Panamanian vs Lumbee In Labor Force | Age 20-64
COMPARE
Panamanian
Lumbee
In Labor Force | Age 20-64
In Labor Force | Age 20-64 Comparison
Panamanians
Lumbee
79.1%
IN LABOR FORCE | AGE 20-64
5.7/ 100
METRIC RATING
228th/ 347
METRIC RANK
70.6%
IN LABOR FORCE | AGE 20-64
0.0/ 100
METRIC RATING
344th/ 347
METRIC RANK
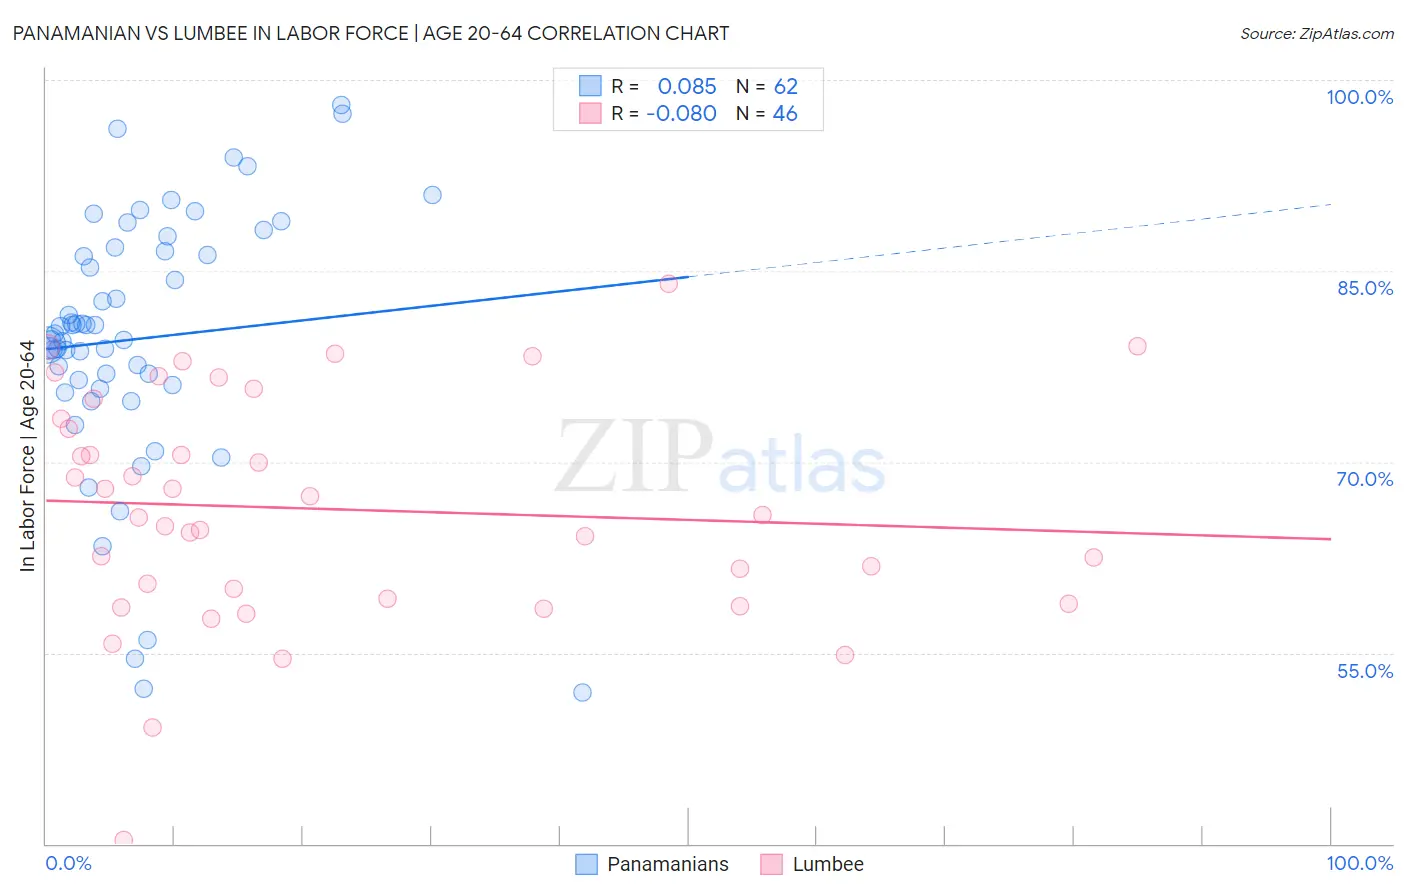
Panamanian vs Lumbee In Labor Force | Age 20-64 Correlation Chart
The statistical analysis conducted on geographies consisting of 281,243,301 people shows a slight positive correlation between the proportion of Panamanians and labor force participation rate among population between the ages 20 and 64 in the United States with a correlation coefficient (R) of 0.085 and weighted average of 79.1%. Similarly, the statistical analysis conducted on geographies consisting of 92,293,168 people shows a slight negative correlation between the proportion of Lumbee and labor force participation rate among population between the ages 20 and 64 in the United States with a correlation coefficient (R) of -0.080 and weighted average of 70.6%, a difference of 12.0%.
In Labor Force | Age 20-64 Correlation Summary
| Measurement | Panamanian | Lumbee |
| Minimum | 51.9% | 40.3% |
| Maximum | 98.0% | 84.0% |
| Range | 46.1% | 43.7% |
| Mean | 79.7% | 66.3% |
| Median | 79.8% | 65.7% |
| Interquartile 25% (IQ1) | 76.0% | 59.2% |
| Interquartile 75% (IQ3) | 86.5% | 73.4% |
| Interquartile Range (IQR) | 10.5% | 14.2% |
| Standard Deviation (Sample) | 10.1% | 9.0% |
| Standard Deviation (Population) | 10.0% | 8.9% |
Similar Demographics by In Labor Force | Age 20-64
Demographics Similar to Panamanians by In Labor Force | Age 20-64
In terms of in labor force | age 20-64, the demographic groups most similar to Panamanians are Alsatian (79.1%, a difference of 0.0%), Native Hawaiian (79.1%, a difference of 0.0%), Central American (79.1%, a difference of 0.010%), Immigrants from Western Europe (79.1%, a difference of 0.010%), and Portuguese (79.1%, a difference of 0.020%).
| Demographics | Rating | Rank | In Labor Force | Age 20-64 |
| Hungarians | 7.2 /100 | #221 | Tragic 79.2% |
| Immigrants | Panama | 6.9 /100 | #222 | Tragic 79.1% |
| Canadians | 6.8 /100 | #223 | Tragic 79.1% |
| Immigrants | Uzbekistan | 6.8 /100 | #224 | Tragic 79.1% |
| Portuguese | 6.4 /100 | #225 | Tragic 79.1% |
| Central Americans | 5.9 /100 | #226 | Tragic 79.1% |
| Immigrants | Western Europe | 5.9 /100 | #227 | Tragic 79.1% |
| Panamanians | 5.7 /100 | #228 | Tragic 79.1% |
| Alsatians | 5.7 /100 | #229 | Tragic 79.1% |
| Native Hawaiians | 5.6 /100 | #230 | Tragic 79.1% |
| Lebanese | 5.1 /100 | #231 | Tragic 79.1% |
| Guamanians/Chamorros | 4.5 /100 | #232 | Tragic 79.1% |
| Japanese | 4.0 /100 | #233 | Tragic 79.1% |
| Immigrants | Canada | 3.2 /100 | #234 | Tragic 79.0% |
| Tlingit-Haida | 3.2 /100 | #235 | Tragic 79.0% |
Demographics Similar to Lumbee by In Labor Force | Age 20-64
In terms of in labor force | age 20-64, the demographic groups most similar to Lumbee are Tohono O'odham (70.4%, a difference of 0.33%), Hopi (71.7%, a difference of 1.5%), Yuman (71.7%, a difference of 1.5%), Navajo (69.2%, a difference of 2.1%), and Pima (69.0%, a difference of 2.3%).
| Demographics | Rating | Rank | In Labor Force | Age 20-64 |
| Natives/Alaskans | 0.0 /100 | #333 | Tragic 73.9% |
| Apache | 0.0 /100 | #334 | Tragic 73.7% |
| Ute | 0.0 /100 | #335 | Tragic 73.7% |
| Crow | 0.0 /100 | #336 | Tragic 73.3% |
| Yup'ik | 0.0 /100 | #337 | Tragic 73.2% |
| Puerto Ricans | 0.0 /100 | #338 | Tragic 73.1% |
| Houma | 0.0 /100 | #339 | Tragic 72.7% |
| Pueblo | 0.0 /100 | #340 | Tragic 72.6% |
| Immigrants | Yemen | 0.0 /100 | #341 | Tragic 72.3% |
| Yuman | 0.0 /100 | #342 | Tragic 71.7% |
| Hopi | 0.0 /100 | #343 | Tragic 71.7% |
| Lumbee | 0.0 /100 | #344 | Tragic 70.6% |
| Tohono O'odham | 0.0 /100 | #345 | Tragic 70.4% |
| Navajo | 0.0 /100 | #346 | Tragic 69.2% |
| Pima | 0.0 /100 | #347 | Tragic 69.0% |