Immigrants from Somalia vs Nonimmigrants In Labor Force | Age 20-64
COMPARE
Immigrants from Somalia
Nonimmigrants
In Labor Force | Age 20-64
In Labor Force | Age 20-64 Comparison
Immigrants from Somalia
Nonimmigrants
81.6%
IN LABOR FORCE | AGE 20-64
100.0/ 100
METRIC RATING
8th/ 347
METRIC RANK
78.1%
IN LABOR FORCE | AGE 20-64
0.0/ 100
METRIC RATING
283rd/ 347
METRIC RANK
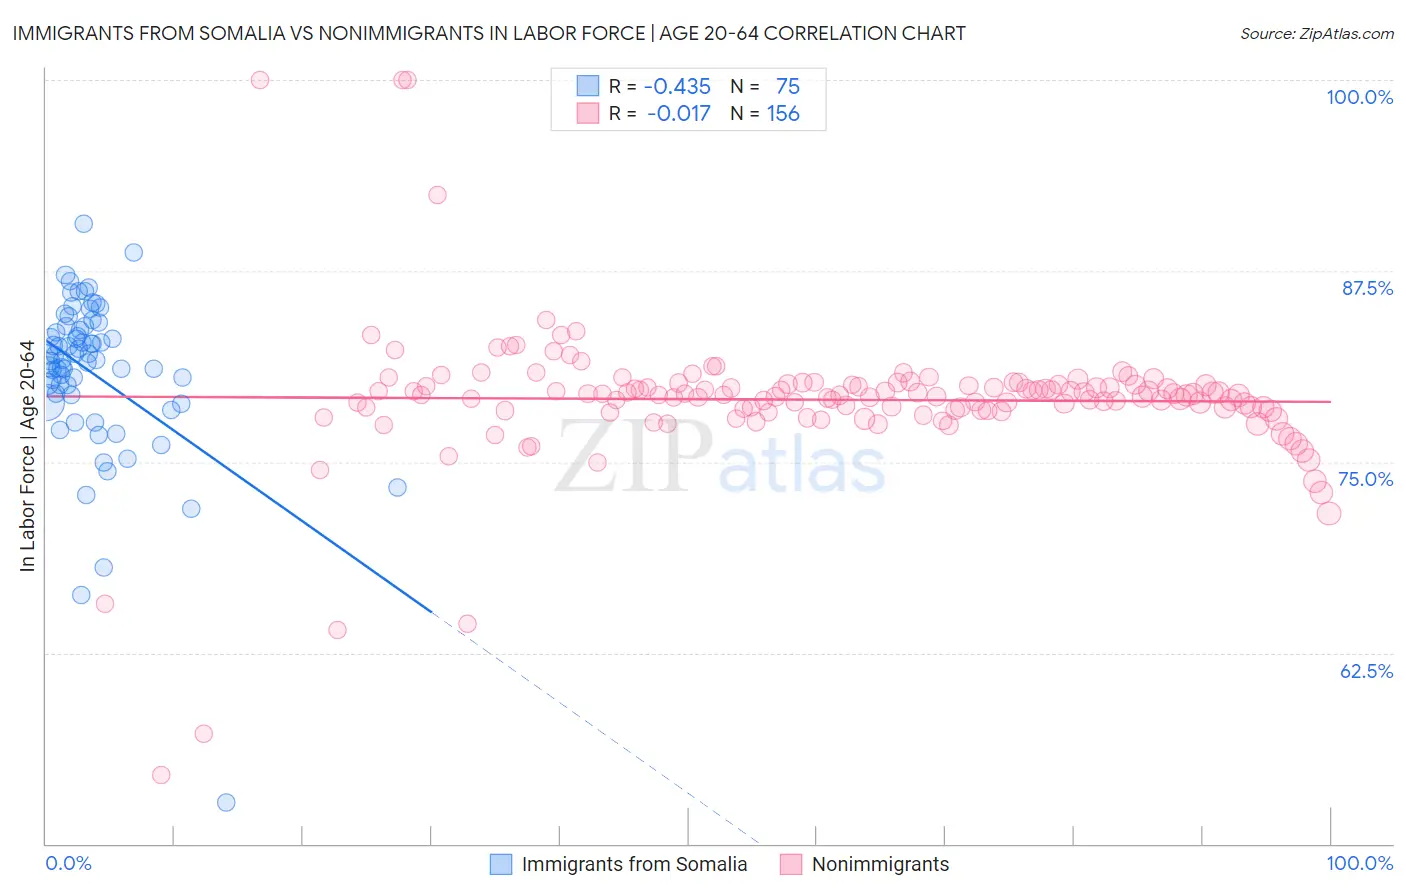
Immigrants from Somalia vs Nonimmigrants In Labor Force | Age 20-64 Correlation Chart
The statistical analysis conducted on geographies consisting of 92,107,842 people shows a moderate negative correlation between the proportion of Immigrants from Somalia and labor force participation rate among population between the ages 20 and 64 in the United States with a correlation coefficient (R) of -0.435 and weighted average of 81.6%. Similarly, the statistical analysis conducted on geographies consisting of 585,321,866 people shows no correlation between the proportion of Nonimmigrants and labor force participation rate among population between the ages 20 and 64 in the United States with a correlation coefficient (R) of -0.017 and weighted average of 78.1%, a difference of 4.5%.
In Labor Force | Age 20-64 Correlation Summary
| Measurement | Immigrants from Somalia | Nonimmigrants |
| Minimum | 52.7% | 54.5% |
| Maximum | 90.6% | 100.0% |
| Range | 37.9% | 45.5% |
| Mean | 80.8% | 79.1% |
| Median | 81.7% | 79.4% |
| Interquartile 25% (IQ1) | 79.4% | 78.4% |
| Interquartile 75% (IQ3) | 83.9% | 80.0% |
| Interquartile Range (IQR) | 4.4% | 1.7% |
| Standard Deviation (Sample) | 5.4% | 4.9% |
| Standard Deviation (Population) | 5.4% | 4.9% |
Similar Demographics by In Labor Force | Age 20-64
Demographics Similar to Immigrants from Somalia by In Labor Force | Age 20-64
In terms of in labor force | age 20-64, the demographic groups most similar to Immigrants from Somalia are Sierra Leonean (81.5%, a difference of 0.0%), Immigrants from Cameroon (81.6%, a difference of 0.020%), Somali (81.6%, a difference of 0.060%), Immigrants from Sierra Leone (81.5%, a difference of 0.12%), and Bolivian (81.7%, a difference of 0.17%).
| Demographics | Rating | Rank | In Labor Force | Age 20-64 |
| Immigrants | Ethiopia | 100.0 /100 | #1 | Exceptional 82.1% |
| Ethiopians | 100.0 /100 | #2 | Exceptional 82.0% |
| Immigrants | Bolivia | 100.0 /100 | #3 | Exceptional 81.9% |
| Luxembourgers | 100.0 /100 | #4 | Exceptional 81.9% |
| Bolivians | 100.0 /100 | #5 | Exceptional 81.7% |
| Somalis | 100.0 /100 | #6 | Exceptional 81.6% |
| Immigrants | Cameroon | 100.0 /100 | #7 | Exceptional 81.6% |
| Immigrants | Somalia | 100.0 /100 | #8 | Exceptional 81.6% |
| Sierra Leoneans | 100.0 /100 | #9 | Exceptional 81.5% |
| Immigrants | Sierra Leone | 100.0 /100 | #10 | Exceptional 81.5% |
| Immigrants | Eastern Africa | 100.0 /100 | #11 | Exceptional 81.3% |
| Immigrants | Eritrea | 100.0 /100 | #12 | Exceptional 81.3% |
| Immigrants | India | 100.0 /100 | #13 | Exceptional 81.3% |
| Cambodians | 100.0 /100 | #14 | Exceptional 81.1% |
| Bulgarians | 100.0 /100 | #15 | Exceptional 81.1% |
Demographics Similar to Nonimmigrants by In Labor Force | Age 20-64
In terms of in labor force | age 20-64, the demographic groups most similar to Nonimmigrants are Immigrants from St. Vincent and the Grenadines (78.1%, a difference of 0.010%), Immigrants from Guyana (78.1%, a difference of 0.010%), Guyanese (78.1%, a difference of 0.030%), Immigrants from Dominica (78.1%, a difference of 0.060%), and Belizean (78.2%, a difference of 0.11%).
| Demographics | Rating | Rank | In Labor Force | Age 20-64 |
| Puget Sound Salish | 0.0 /100 | #276 | Tragic 78.2% |
| Immigrants | Bahamas | 0.0 /100 | #277 | Tragic 78.2% |
| Mexican American Indians | 0.0 /100 | #278 | Tragic 78.2% |
| Belizeans | 0.0 /100 | #279 | Tragic 78.2% |
| Immigrants | Dominica | 0.0 /100 | #280 | Tragic 78.1% |
| Guyanese | 0.0 /100 | #281 | Tragic 78.1% |
| Immigrants | St. Vincent and the Grenadines | 0.0 /100 | #282 | Tragic 78.1% |
| Immigrants | Nonimmigrants | 0.0 /100 | #283 | Tragic 78.1% |
| Immigrants | Guyana | 0.0 /100 | #284 | Tragic 78.1% |
| Osage | 0.0 /100 | #285 | Tragic 78.0% |
| Immigrants | Belize | 0.0 /100 | #286 | Tragic 78.0% |
| Vietnamese | 0.0 /100 | #287 | Tragic 78.0% |
| Hmong | 0.0 /100 | #288 | Tragic 77.9% |
| Africans | 0.0 /100 | #289 | Tragic 77.9% |
| Immigrants | Bangladesh | 0.0 /100 | #290 | Tragic 77.9% |