Panamanian vs Nonimmigrants Unemployment Among Ages 30 to 34 years
COMPARE
Panamanian
Nonimmigrants
Unemployment Among Ages 30 to 34 years
Unemployment Among Ages 30 to 34 years Comparison
Panamanians
Nonimmigrants
5.8%
UNEMPLOYMENT AMONG AGES 30 TO 34 YEARS
4.5/ 100
METRIC RATING
218th/ 347
METRIC RANK
6.1%
UNEMPLOYMENT AMONG AGES 30 TO 34 YEARS
0.2/ 100
METRIC RATING
253rd/ 347
METRIC RANK
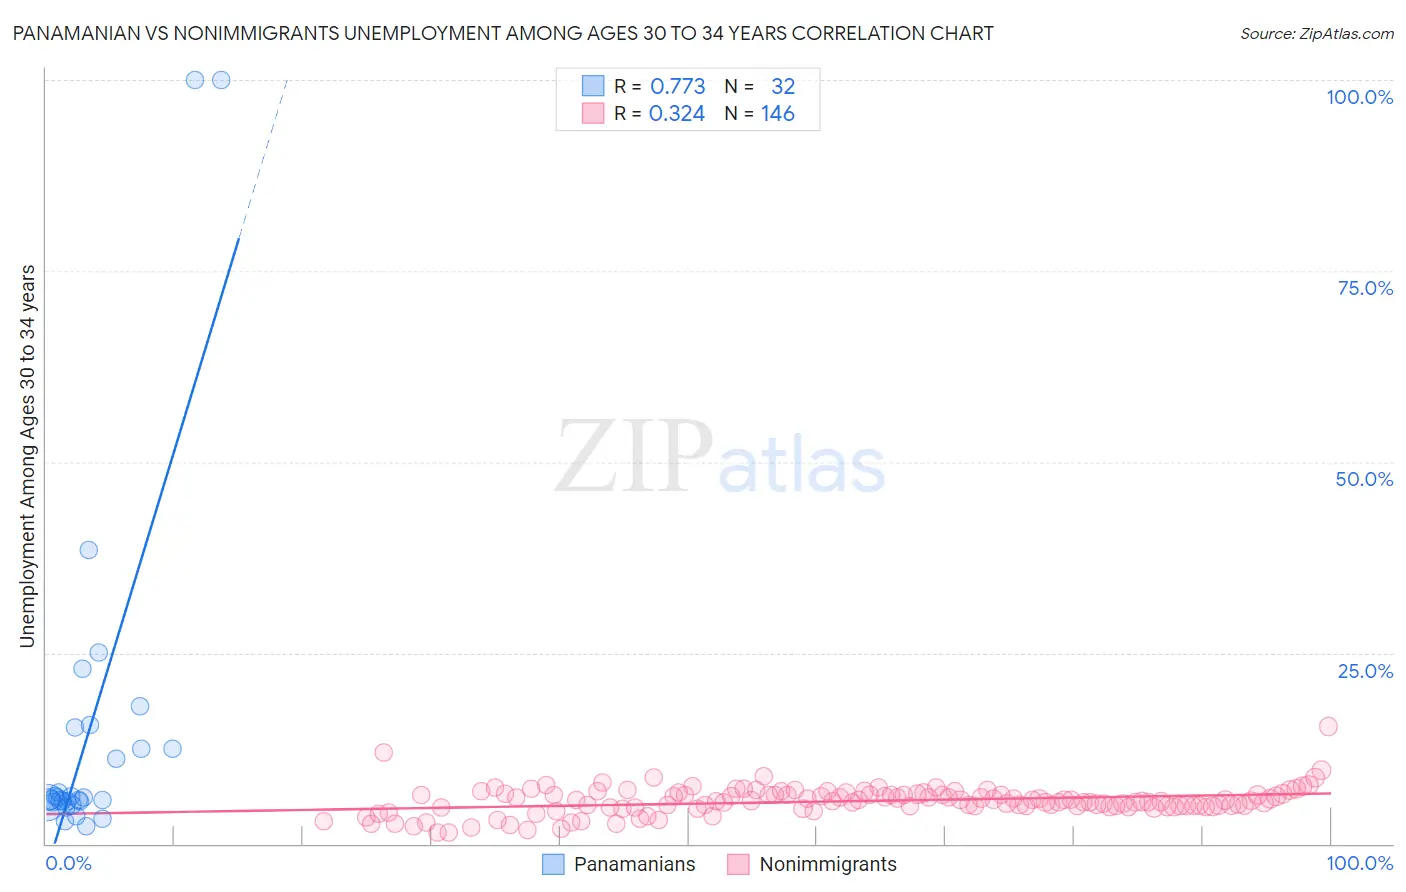
Panamanian vs Nonimmigrants Unemployment Among Ages 30 to 34 years Correlation Chart
The statistical analysis conducted on geographies consisting of 272,068,677 people shows a strong positive correlation between the proportion of Panamanians and unemployment rate among population between the ages 30 and 34 in the United States with a correlation coefficient (R) of 0.773 and weighted average of 5.8%. Similarly, the statistical analysis conducted on geographies consisting of 505,242,058 people shows a mild positive correlation between the proportion of Nonimmigrants and unemployment rate among population between the ages 30 and 34 in the United States with a correlation coefficient (R) of 0.324 and weighted average of 6.1%, a difference of 5.3%.
Unemployment Among Ages 30 to 34 years Correlation Summary
| Measurement | Panamanian | Nonimmigrants |
| Minimum | 2.3% | 1.4% |
| Maximum | 100.0% | 15.3% |
| Range | 97.7% | 13.9% |
| Mean | 15.0% | 5.6% |
| Median | 5.9% | 5.6% |
| Interquartile 25% (IQ1) | 5.5% | 4.9% |
| Interquartile 75% (IQ3) | 13.8% | 6.5% |
| Interquartile Range (IQR) | 8.4% | 1.6% |
| Standard Deviation (Sample) | 23.6% | 1.8% |
| Standard Deviation (Population) | 23.2% | 1.8% |
Similar Demographics by Unemployment Among Ages 30 to 34 years
Demographics Similar to Panamanians by Unemployment Among Ages 30 to 34 years
In terms of unemployment among ages 30 to 34 years, the demographic groups most similar to Panamanians are French Canadian (5.8%, a difference of 0.030%), Immigrants from Fiji (5.7%, a difference of 0.21%), Sierra Leonean (5.8%, a difference of 0.24%), Guamanian/Chamorro (5.8%, a difference of 0.26%), and Immigrants from Syria (5.7%, a difference of 0.35%).
| Demographics | Rating | Rank | Unemployment Among Ages 30 to 34 years |
| Spanish American Indians | 8.7 /100 | #211 | Tragic 5.7% |
| Scotch-Irish | 8.6 /100 | #212 | Tragic 5.7% |
| Immigrants | Immigrants | 7.1 /100 | #213 | Tragic 5.7% |
| Immigrants | Panama | 5.9 /100 | #214 | Tragic 5.7% |
| Immigrants | Cambodia | 5.8 /100 | #215 | Tragic 5.7% |
| Immigrants | Syria | 5.5 /100 | #216 | Tragic 5.7% |
| Immigrants | Fiji | 5.1 /100 | #217 | Tragic 5.7% |
| Panamanians | 4.5 /100 | #218 | Tragic 5.8% |
| French Canadians | 4.4 /100 | #219 | Tragic 5.8% |
| Sierra Leoneans | 3.9 /100 | #220 | Tragic 5.8% |
| Guamanians/Chamorros | 3.9 /100 | #221 | Tragic 5.8% |
| Spaniards | 3.2 /100 | #222 | Tragic 5.8% |
| Bermudans | 2.7 /100 | #223 | Tragic 5.8% |
| Slovaks | 2.5 /100 | #224 | Tragic 5.8% |
| Samoans | 2.5 /100 | #225 | Tragic 5.8% |
Demographics Similar to Nonimmigrants by Unemployment Among Ages 30 to 34 years
In terms of unemployment among ages 30 to 34 years, the demographic groups most similar to Nonimmigrants are Potawatomi (6.0%, a difference of 0.34%), Tlingit-Haida (6.0%, a difference of 0.36%), Immigrants from Honduras (6.0%, a difference of 0.55%), Armenian (6.1%, a difference of 0.63%), and Immigrants from Guatemala (6.0%, a difference of 0.65%).
| Demographics | Rating | Rank | Unemployment Among Ages 30 to 34 years |
| Ghanaians | 0.3 /100 | #246 | Tragic 6.0% |
| Nigerians | 0.3 /100 | #247 | Tragic 6.0% |
| Immigrants | Guatemala | 0.3 /100 | #248 | Tragic 6.0% |
| Hondurans | 0.3 /100 | #249 | Tragic 6.0% |
| Immigrants | Honduras | 0.3 /100 | #250 | Tragic 6.0% |
| Tlingit-Haida | 0.2 /100 | #251 | Tragic 6.0% |
| Potawatomi | 0.2 /100 | #252 | Tragic 6.0% |
| Immigrants | Nonimmigrants | 0.2 /100 | #253 | Tragic 6.1% |
| Armenians | 0.1 /100 | #254 | Tragic 6.1% |
| Immigrants | Portugal | 0.1 /100 | #255 | Tragic 6.1% |
| Immigrants | Ghana | 0.1 /100 | #256 | Tragic 6.1% |
| Immigrants | Sierra Leone | 0.1 /100 | #257 | Tragic 6.1% |
| Mexicans | 0.1 /100 | #258 | Tragic 6.1% |
| Haitians | 0.1 /100 | #259 | Tragic 6.1% |
| Immigrants | Latin America | 0.1 /100 | #260 | Tragic 6.1% |