Immigrants from Latin America vs Nonimmigrants In Labor Force | Age 20-64
COMPARE
Immigrants from Latin America
Nonimmigrants
In Labor Force | Age 20-64
In Labor Force | Age 20-64 Comparison
Immigrants from Latin America
Nonimmigrants
78.3%
IN LABOR FORCE | AGE 20-64
0.0/ 100
METRIC RATING
271st/ 347
METRIC RANK
78.1%
IN LABOR FORCE | AGE 20-64
0.0/ 100
METRIC RATING
283rd/ 347
METRIC RANK
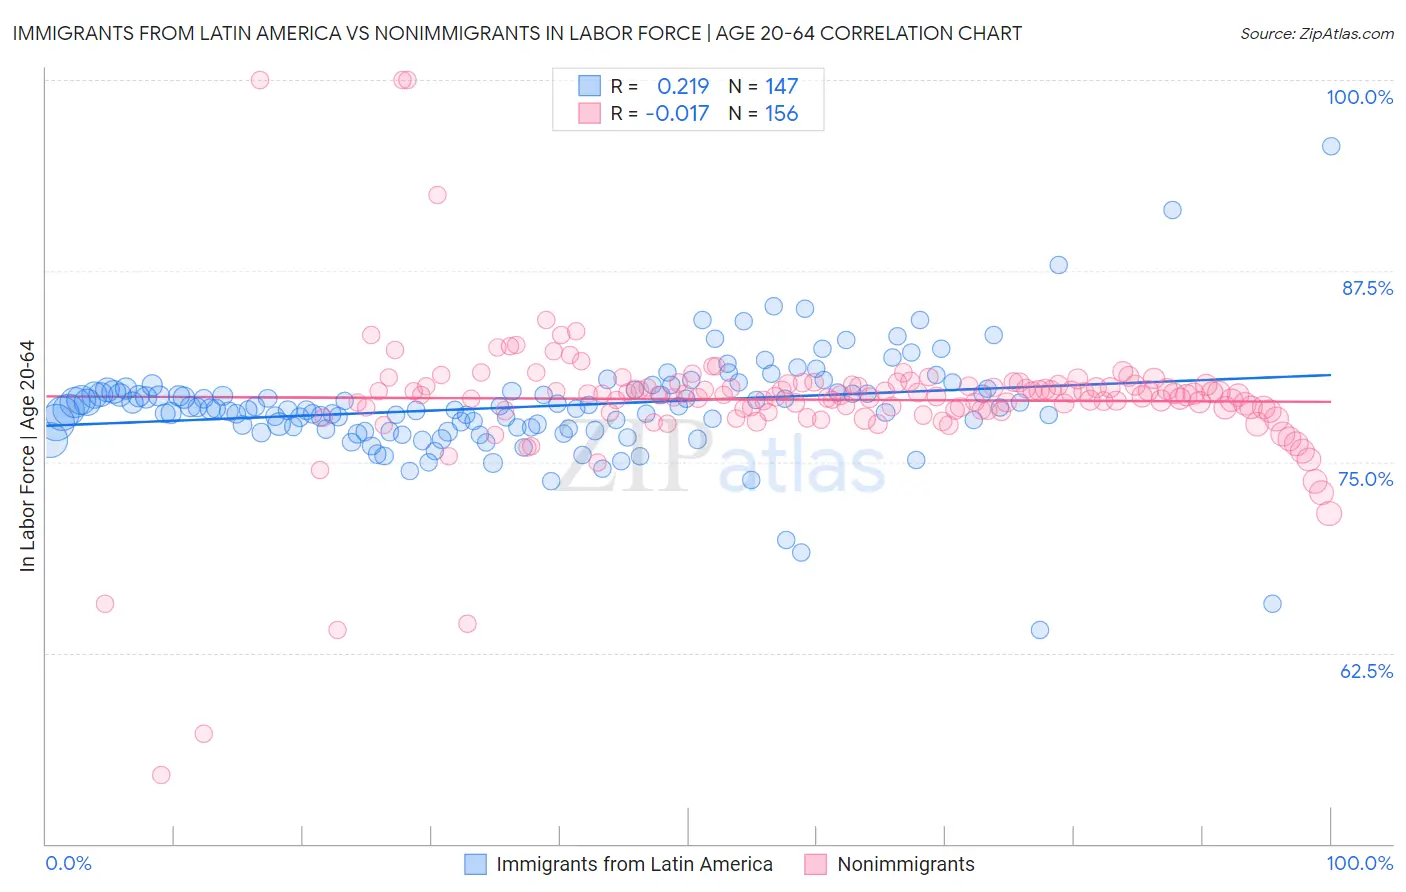
Immigrants from Latin America vs Nonimmigrants In Labor Force | Age 20-64 Correlation Chart
The statistical analysis conducted on geographies consisting of 558,614,775 people shows a weak positive correlation between the proportion of Immigrants from Latin America and labor force participation rate among population between the ages 20 and 64 in the United States with a correlation coefficient (R) of 0.219 and weighted average of 78.3%. Similarly, the statistical analysis conducted on geographies consisting of 585,321,866 people shows no correlation between the proportion of Nonimmigrants and labor force participation rate among population between the ages 20 and 64 in the United States with a correlation coefficient (R) of -0.017 and weighted average of 78.1%, a difference of 0.26%.
In Labor Force | Age 20-64 Correlation Summary
| Measurement | Immigrants from Latin America | Nonimmigrants |
| Minimum | 64.0% | 54.5% |
| Maximum | 95.7% | 100.0% |
| Range | 31.7% | 45.5% |
| Mean | 78.6% | 79.1% |
| Median | 78.5% | 79.4% |
| Interquartile 25% (IQ1) | 77.2% | 78.4% |
| Interquartile 75% (IQ3) | 79.6% | 80.0% |
| Interquartile Range (IQR) | 2.4% | 1.7% |
| Standard Deviation (Sample) | 3.5% | 4.9% |
| Standard Deviation (Population) | 3.5% | 4.9% |
Demographics Similar to Immigrants from Latin America and Nonimmigrants by In Labor Force | Age 20-64
In terms of in labor force | age 20-64, the demographic groups most similar to Immigrants from Latin America are Marshallese (78.3%, a difference of 0.0%), Scotch-Irish (78.3%, a difference of 0.020%), Immigrants from Barbados (78.3%, a difference of 0.040%), French American Indian (78.2%, a difference of 0.050%), and Aleut (78.2%, a difference of 0.070%). Similarly, the demographic groups most similar to Nonimmigrants are Immigrants from St. Vincent and the Grenadines (78.1%, a difference of 0.010%), Immigrants from Guyana (78.1%, a difference of 0.010%), Guyanese (78.1%, a difference of 0.030%), Immigrants from Dominica (78.1%, a difference of 0.060%), and Belizean (78.2%, a difference of 0.11%).
| Demographics | Rating | Rank | In Labor Force | Age 20-64 |
| U.S. Virgin Islanders | 0.1 /100 | #267 | Tragic 78.4% |
| West Indians | 0.0 /100 | #268 | Tragic 78.3% |
| Immigrants | Barbados | 0.0 /100 | #269 | Tragic 78.3% |
| Scotch-Irish | 0.0 /100 | #270 | Tragic 78.3% |
| Immigrants | Latin America | 0.0 /100 | #271 | Tragic 78.3% |
| Marshallese | 0.0 /100 | #272 | Tragic 78.3% |
| French American Indians | 0.0 /100 | #273 | Tragic 78.2% |
| Aleuts | 0.0 /100 | #274 | Tragic 78.2% |
| Spanish | 0.0 /100 | #275 | Tragic 78.2% |
| Puget Sound Salish | 0.0 /100 | #276 | Tragic 78.2% |
| Immigrants | Bahamas | 0.0 /100 | #277 | Tragic 78.2% |
| Mexican American Indians | 0.0 /100 | #278 | Tragic 78.2% |
| Belizeans | 0.0 /100 | #279 | Tragic 78.2% |
| Immigrants | Dominica | 0.0 /100 | #280 | Tragic 78.1% |
| Guyanese | 0.0 /100 | #281 | Tragic 78.1% |
| Immigrants | St. Vincent and the Grenadines | 0.0 /100 | #282 | Tragic 78.1% |
| Immigrants | Nonimmigrants | 0.0 /100 | #283 | Tragic 78.1% |
| Immigrants | Guyana | 0.0 /100 | #284 | Tragic 78.1% |
| Osage | 0.0 /100 | #285 | Tragic 78.0% |
| Immigrants | Belize | 0.0 /100 | #286 | Tragic 78.0% |
| Vietnamese | 0.0 /100 | #287 | Tragic 78.0% |