Haitian vs Lumbee In Labor Force | Age 20-64
COMPARE
Haitian
Lumbee
In Labor Force | Age 20-64
In Labor Force | Age 20-64 Comparison
Haitians
Lumbee
79.3%
IN LABOR FORCE | AGE 20-64
16.1/ 100
METRIC RATING
210th/ 347
METRIC RANK
70.6%
IN LABOR FORCE | AGE 20-64
0.0/ 100
METRIC RATING
344th/ 347
METRIC RANK
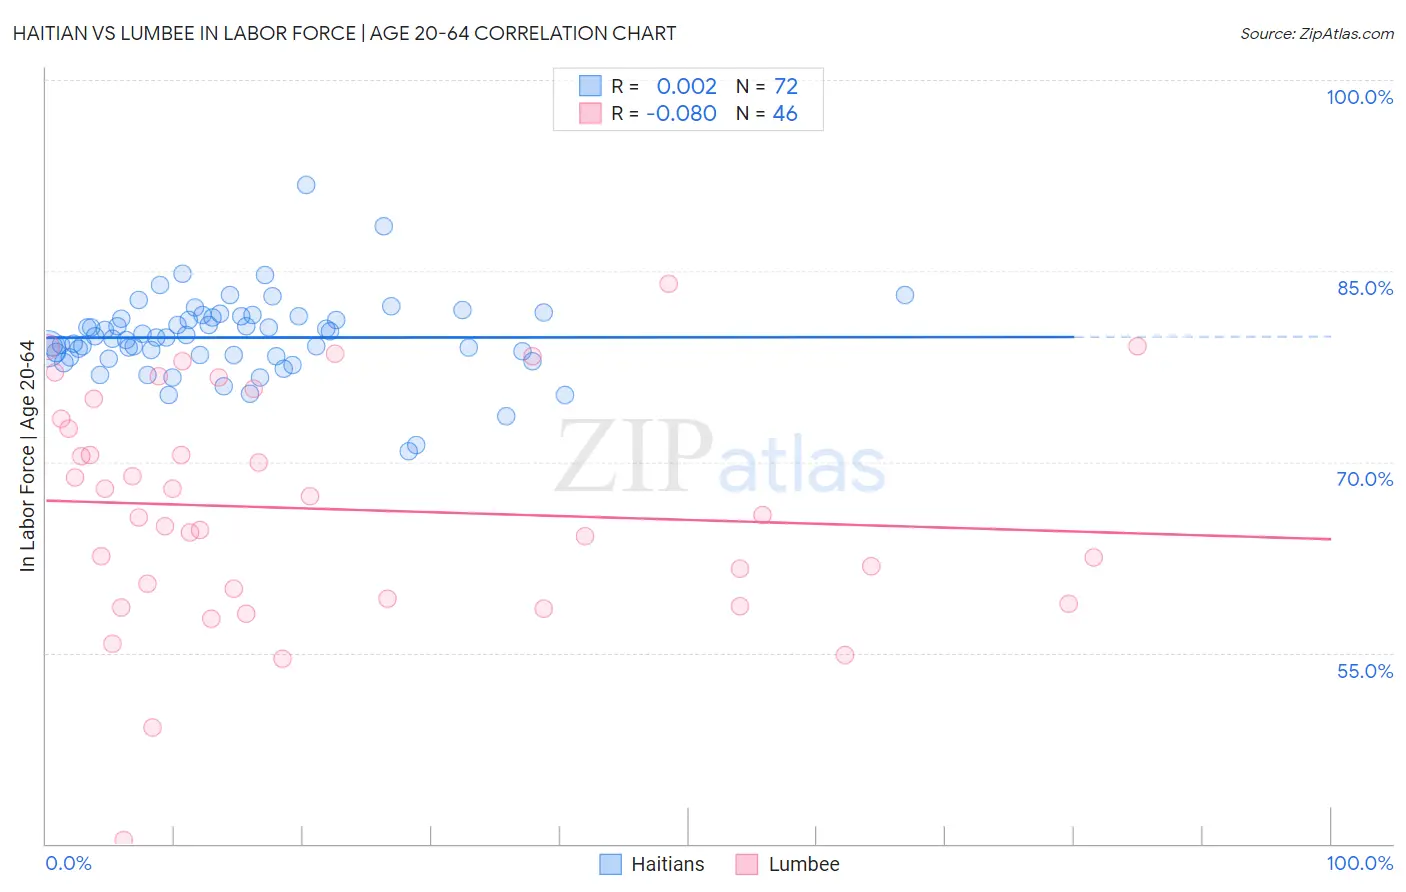
Haitian vs Lumbee In Labor Force | Age 20-64 Correlation Chart
The statistical analysis conducted on geographies consisting of 288,005,599 people shows no correlation between the proportion of Haitians and labor force participation rate among population between the ages 20 and 64 in the United States with a correlation coefficient (R) of 0.002 and weighted average of 79.3%. Similarly, the statistical analysis conducted on geographies consisting of 92,293,168 people shows a slight negative correlation between the proportion of Lumbee and labor force participation rate among population between the ages 20 and 64 in the United States with a correlation coefficient (R) of -0.080 and weighted average of 70.6%, a difference of 12.3%.
In Labor Force | Age 20-64 Correlation Summary
| Measurement | Haitian | Lumbee |
| Minimum | 70.8% | 40.3% |
| Maximum | 91.8% | 84.0% |
| Range | 21.0% | 43.7% |
| Mean | 79.8% | 66.3% |
| Median | 79.8% | 65.7% |
| Interquartile 25% (IQ1) | 78.3% | 59.2% |
| Interquartile 75% (IQ3) | 81.4% | 73.4% |
| Interquartile Range (IQR) | 3.1% | 14.2% |
| Standard Deviation (Sample) | 3.2% | 9.0% |
| Standard Deviation (Population) | 3.2% | 8.9% |
Similar Demographics by In Labor Force | Age 20-64
Demographics Similar to Haitians by In Labor Force | Age 20-64
In terms of in labor force | age 20-64, the demographic groups most similar to Haitians are Bangladeshi (79.3%, a difference of 0.0%), Immigrants from Ecuador (79.3%, a difference of 0.010%), Subsaharan African (79.3%, a difference of 0.010%), British (79.3%, a difference of 0.010%), and European (79.3%, a difference of 0.010%).
| Demographics | Rating | Rank | In Labor Force | Age 20-64 |
| Iraqis | 17.7 /100 | #203 | Poor 79.3% |
| Immigrants | Cambodia | 17.6 /100 | #204 | Poor 79.3% |
| Immigrants | Congo | 17.5 /100 | #205 | Poor 79.3% |
| Immigrants | Ecuador | 16.9 /100 | #206 | Poor 79.3% |
| Sub-Saharan Africans | 16.5 /100 | #207 | Poor 79.3% |
| British | 16.5 /100 | #208 | Poor 79.3% |
| Bangladeshis | 16.4 /100 | #209 | Poor 79.3% |
| Haitians | 16.1 /100 | #210 | Poor 79.3% |
| Europeans | 15.3 /100 | #211 | Poor 79.3% |
| Irish | 13.2 /100 | #212 | Poor 79.3% |
| Immigrants | Portugal | 12.8 /100 | #213 | Poor 79.3% |
| Immigrants | Armenia | 12.2 /100 | #214 | Poor 79.2% |
| Immigrants | Norway | 12.0 /100 | #215 | Poor 79.2% |
| Arabs | 11.4 /100 | #216 | Poor 79.2% |
| Immigrants | Western Asia | 11.0 /100 | #217 | Poor 79.2% |
Demographics Similar to Lumbee by In Labor Force | Age 20-64
In terms of in labor force | age 20-64, the demographic groups most similar to Lumbee are Tohono O'odham (70.4%, a difference of 0.33%), Hopi (71.7%, a difference of 1.5%), Yuman (71.7%, a difference of 1.5%), Navajo (69.2%, a difference of 2.1%), and Pima (69.0%, a difference of 2.3%).
| Demographics | Rating | Rank | In Labor Force | Age 20-64 |
| Natives/Alaskans | 0.0 /100 | #333 | Tragic 73.9% |
| Apache | 0.0 /100 | #334 | Tragic 73.7% |
| Ute | 0.0 /100 | #335 | Tragic 73.7% |
| Crow | 0.0 /100 | #336 | Tragic 73.3% |
| Yup'ik | 0.0 /100 | #337 | Tragic 73.2% |
| Puerto Ricans | 0.0 /100 | #338 | Tragic 73.1% |
| Houma | 0.0 /100 | #339 | Tragic 72.7% |
| Pueblo | 0.0 /100 | #340 | Tragic 72.6% |
| Immigrants | Yemen | 0.0 /100 | #341 | Tragic 72.3% |
| Yuman | 0.0 /100 | #342 | Tragic 71.7% |
| Hopi | 0.0 /100 | #343 | Tragic 71.7% |
| Lumbee | 0.0 /100 | #344 | Tragic 70.6% |
| Tohono O'odham | 0.0 /100 | #345 | Tragic 70.4% |
| Navajo | 0.0 /100 | #346 | Tragic 69.2% |
| Pima | 0.0 /100 | #347 | Tragic 69.0% |