Panamanian vs Immigrants from Switzerland In Labor Force | Age 45-54
COMPARE
Panamanian
Immigrants from Switzerland
In Labor Force | Age 45-54
In Labor Force | Age 45-54 Comparison
Panamanians
Immigrants from Switzerland
82.2%
IN LABOR FORCE | AGE 45-54
3.5/ 100
METRIC RATING
221st/ 347
METRIC RANK
82.7%
IN LABOR FORCE | AGE 45-54
39.4/ 100
METRIC RATING
179th/ 347
METRIC RANK
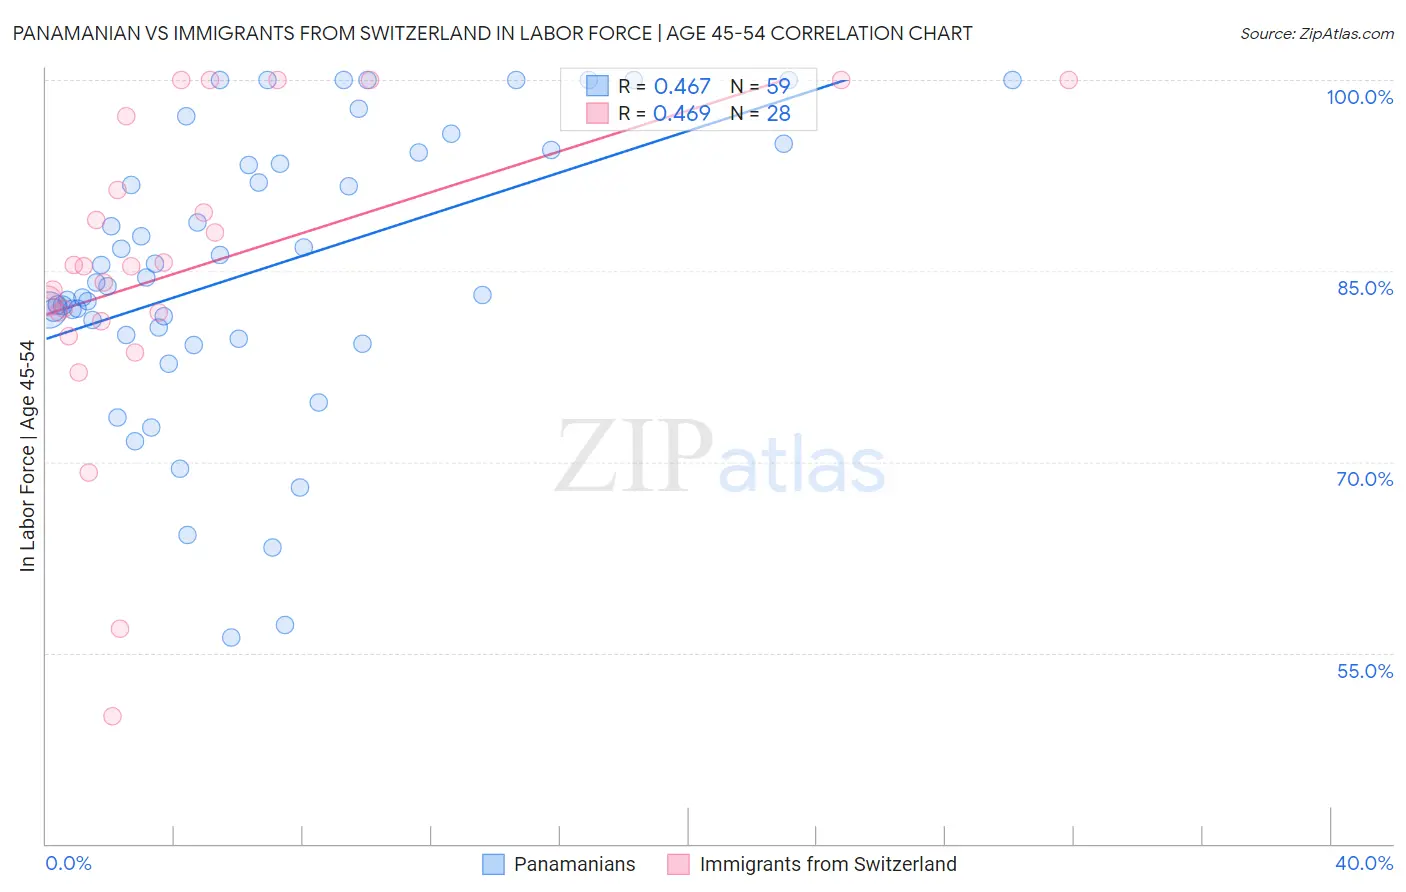
Panamanian vs Immigrants from Switzerland In Labor Force | Age 45-54 Correlation Chart
The statistical analysis conducted on geographies consisting of 281,072,319 people shows a moderate positive correlation between the proportion of Panamanians and labor force participation rate among population between the ages 45 and 54 in the United States with a correlation coefficient (R) of 0.467 and weighted average of 82.2%. Similarly, the statistical analysis conducted on geographies consisting of 148,071,705 people shows a moderate positive correlation between the proportion of Immigrants from Switzerland and labor force participation rate among population between the ages 45 and 54 in the United States with a correlation coefficient (R) of 0.469 and weighted average of 82.7%, a difference of 0.64%.
In Labor Force | Age 45-54 Correlation Summary
| Measurement | Panamanian | Immigrants from Switzerland |
| Minimum | 56.2% | 50.0% |
| Maximum | 100.0% | 100.0% |
| Range | 43.8% | 50.0% |
| Mean | 85.1% | 85.2% |
| Median | 84.1% | 85.4% |
| Interquartile 25% (IQ1) | 79.9% | 81.4% |
| Interquartile 75% (IQ3) | 94.3% | 94.3% |
| Interquartile Range (IQR) | 14.4% | 12.9% |
| Standard Deviation (Sample) | 10.9% | 12.2% |
| Standard Deviation (Population) | 10.8% | 12.0% |
Similar Demographics by In Labor Force | Age 45-54
Demographics Similar to Panamanians by In Labor Force | Age 45-54
In terms of in labor force | age 45-54, the demographic groups most similar to Panamanians are Immigrants from Ecuador (82.2%, a difference of 0.0%), Bahamian (82.2%, a difference of 0.010%), Immigrants (82.1%, a difference of 0.020%), French (82.2%, a difference of 0.040%), and English (82.2%, a difference of 0.050%).
| Demographics | Rating | Rank | In Labor Force | Age 45-54 |
| Immigrants | Panama | 5.6 /100 | #214 | Tragic 82.2% |
| Iraqis | 5.6 /100 | #215 | Tragic 82.2% |
| Scottish | 5.3 /100 | #216 | Tragic 82.2% |
| Portuguese | 4.7 /100 | #217 | Tragic 82.2% |
| English | 4.4 /100 | #218 | Tragic 82.2% |
| French | 4.1 /100 | #219 | Tragic 82.2% |
| Bahamians | 3.6 /100 | #220 | Tragic 82.2% |
| Panamanians | 3.5 /100 | #221 | Tragic 82.2% |
| Immigrants | Ecuador | 3.4 /100 | #222 | Tragic 82.2% |
| Immigrants | Immigrants | 3.1 /100 | #223 | Tragic 82.1% |
| Immigrants | Jamaica | 2.7 /100 | #224 | Tragic 82.1% |
| Immigrants | Oceania | 2.5 /100 | #225 | Tragic 82.1% |
| Immigrants | Caribbean | 2.5 /100 | #226 | Tragic 82.1% |
| Immigrants | Germany | 2.4 /100 | #227 | Tragic 82.1% |
| Cape Verdeans | 2.1 /100 | #228 | Tragic 82.1% |
Demographics Similar to Immigrants from Switzerland by In Labor Force | Age 45-54
In terms of in labor force | age 45-54, the demographic groups most similar to Immigrants from Switzerland are Nigerian (82.7%, a difference of 0.010%), Hungarian (82.7%, a difference of 0.010%), Israeli (82.7%, a difference of 0.020%), Immigrants from Hungary (82.7%, a difference of 0.020%), and Immigrants from Nicaragua (82.7%, a difference of 0.050%).
| Demographics | Rating | Rank | In Labor Force | Age 45-54 |
| Icelanders | 51.8 /100 | #172 | Average 82.8% |
| Nicaraguans | 50.3 /100 | #173 | Average 82.8% |
| Costa Ricans | 50.0 /100 | #174 | Average 82.8% |
| Immigrants | Liberia | 47.9 /100 | #175 | Average 82.7% |
| Northern Europeans | 46.9 /100 | #176 | Average 82.7% |
| Immigrants | Nicaragua | 44.6 /100 | #177 | Average 82.7% |
| Nigerians | 40.5 /100 | #178 | Average 82.7% |
| Immigrants | Switzerland | 39.4 /100 | #179 | Fair 82.7% |
| Hungarians | 38.0 /100 | #180 | Fair 82.7% |
| Israelis | 37.7 /100 | #181 | Fair 82.7% |
| Immigrants | Hungary | 37.1 /100 | #182 | Fair 82.7% |
| New Zealanders | 32.7 /100 | #183 | Fair 82.6% |
| Europeans | 32.6 /100 | #184 | Fair 82.6% |
| Immigrants | England | 32.2 /100 | #185 | Fair 82.6% |
| Irish | 29.2 /100 | #186 | Fair 82.6% |