Panamanian vs Immigrants from Switzerland 7th Grade
COMPARE
Panamanian
Immigrants from Switzerland
7th Grade
7th Grade Comparison
Panamanians
Immigrants from Switzerland
95.9%
7TH GRADE
32.3/ 100
METRIC RATING
192nd/ 347
METRIC RANK
96.5%
7TH GRADE
94.5/ 100
METRIC RATING
124th/ 347
METRIC RANK
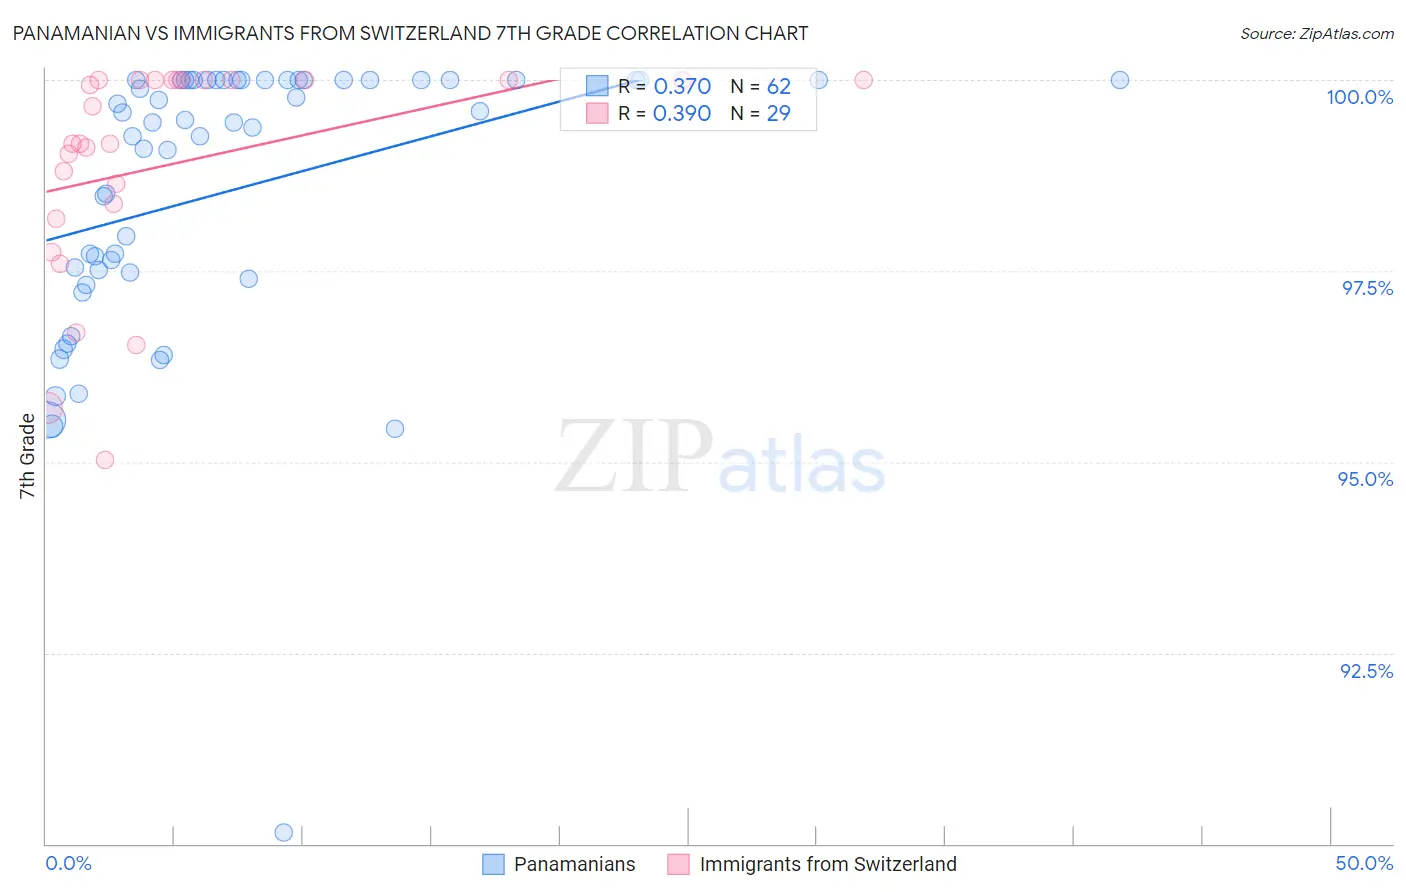
Panamanian vs Immigrants from Switzerland 7th Grade Correlation Chart
The statistical analysis conducted on geographies consisting of 281,248,945 people shows a mild positive correlation between the proportion of Panamanians and percentage of population with at least 7th grade education in the United States with a correlation coefficient (R) of 0.370 and weighted average of 95.9%. Similarly, the statistical analysis conducted on geographies consisting of 148,082,451 people shows a mild positive correlation between the proportion of Immigrants from Switzerland and percentage of population with at least 7th grade education in the United States with a correlation coefficient (R) of 0.390 and weighted average of 96.5%, a difference of 0.55%.
7th Grade Correlation Summary
| Measurement | Panamanian | Immigrants from Switzerland |
| Minimum | 90.1% | 95.0% |
| Maximum | 100.0% | 100.0% |
| Range | 9.9% | 5.0% |
| Mean | 98.5% | 98.9% |
| Median | 99.5% | 99.2% |
| Interquartile 25% (IQ1) | 97.5% | 98.3% |
| Interquartile 75% (IQ3) | 100.0% | 100.0% |
| Interquartile Range (IQR) | 2.5% | 1.7% |
| Standard Deviation (Sample) | 1.9% | 1.4% |
| Standard Deviation (Population) | 1.8% | 1.4% |
Similar Demographics by 7th Grade
Demographics Similar to Panamanians by 7th Grade
In terms of 7th grade, the demographic groups most similar to Panamanians are Immigrants from Micronesia (95.9%, a difference of 0.0%), Liberian (95.9%, a difference of 0.0%), Immigrants from Egypt (95.9%, a difference of 0.010%), Immigrants from Venezuela (95.9%, a difference of 0.010%), and Immigrants from Bahamas (95.9%, a difference of 0.010%).
| Demographics | Rating | Rank | 7th Grade |
| Brazilians | 37.3 /100 | #185 | Fair 96.0% |
| Immigrants | Iraq | 36.1 /100 | #186 | Fair 96.0% |
| Immigrants | Uganda | 36.0 /100 | #187 | Fair 96.0% |
| Immigrants | Egypt | 34.3 /100 | #188 | Fair 95.9% |
| Immigrants | Venezuela | 33.9 /100 | #189 | Fair 95.9% |
| Immigrants | Micronesia | 32.6 /100 | #190 | Fair 95.9% |
| Liberians | 32.5 /100 | #191 | Fair 95.9% |
| Panamanians | 32.3 /100 | #192 | Fair 95.9% |
| Immigrants | Bahamas | 30.8 /100 | #193 | Fair 95.9% |
| Immigrants | Nepal | 30.0 /100 | #194 | Fair 95.9% |
| Sudanese | 28.1 /100 | #195 | Fair 95.9% |
| Apache | 27.6 /100 | #196 | Fair 95.9% |
| Immigrants | Zaire | 26.7 /100 | #197 | Fair 95.9% |
| Paraguayans | 24.8 /100 | #198 | Fair 95.9% |
| Guamanians/Chamorros | 23.5 /100 | #199 | Fair 95.9% |
Demographics Similar to Immigrants from Switzerland by 7th Grade
In terms of 7th grade, the demographic groups most similar to Immigrants from Switzerland are Cheyenne (96.5%, a difference of 0.010%), Immigrants from Europe (96.5%, a difference of 0.010%), Immigrants from France (96.5%, a difference of 0.010%), Immigrants from Bulgaria (96.4%, a difference of 0.010%), and Immigrants from Norway (96.5%, a difference of 0.020%).
| Demographics | Rating | Rank | 7th Grade |
| Immigrants | Moldova | 95.7 /100 | #117 | Exceptional 96.5% |
| Immigrants | Japan | 95.5 /100 | #118 | Exceptional 96.5% |
| Immigrants | Norway | 95.2 /100 | #119 | Exceptional 96.5% |
| Immigrants | Croatia | 95.0 /100 | #120 | Exceptional 96.5% |
| Cheyenne | 94.9 /100 | #121 | Exceptional 96.5% |
| Immigrants | Europe | 94.8 /100 | #122 | Exceptional 96.5% |
| Immigrants | France | 94.7 /100 | #123 | Exceptional 96.5% |
| Immigrants | Switzerland | 94.5 /100 | #124 | Exceptional 96.5% |
| Immigrants | Bulgaria | 94.0 /100 | #125 | Exceptional 96.4% |
| Palestinians | 93.5 /100 | #126 | Exceptional 96.4% |
| Immigrants | Bosnia and Herzegovina | 93.3 /100 | #127 | Exceptional 96.4% |
| Immigrants | Romania | 93.2 /100 | #128 | Exceptional 96.4% |
| Immigrants | North Macedonia | 93.1 /100 | #129 | Exceptional 96.4% |
| Immigrants | Serbia | 92.8 /100 | #130 | Exceptional 96.4% |
| Filipinos | 92.1 /100 | #131 | Exceptional 96.4% |