Cherokee vs Immigrants from Switzerland In Labor Force | Age 45-54
COMPARE
Cherokee
Immigrants from Switzerland
In Labor Force | Age 45-54
In Labor Force | Age 45-54 Comparison
Cherokee
Immigrants from Switzerland
79.0%
IN LABOR FORCE | AGE 45-54
0.0/ 100
METRIC RATING
319th/ 347
METRIC RANK
82.7%
IN LABOR FORCE | AGE 45-54
39.4/ 100
METRIC RATING
179th/ 347
METRIC RANK
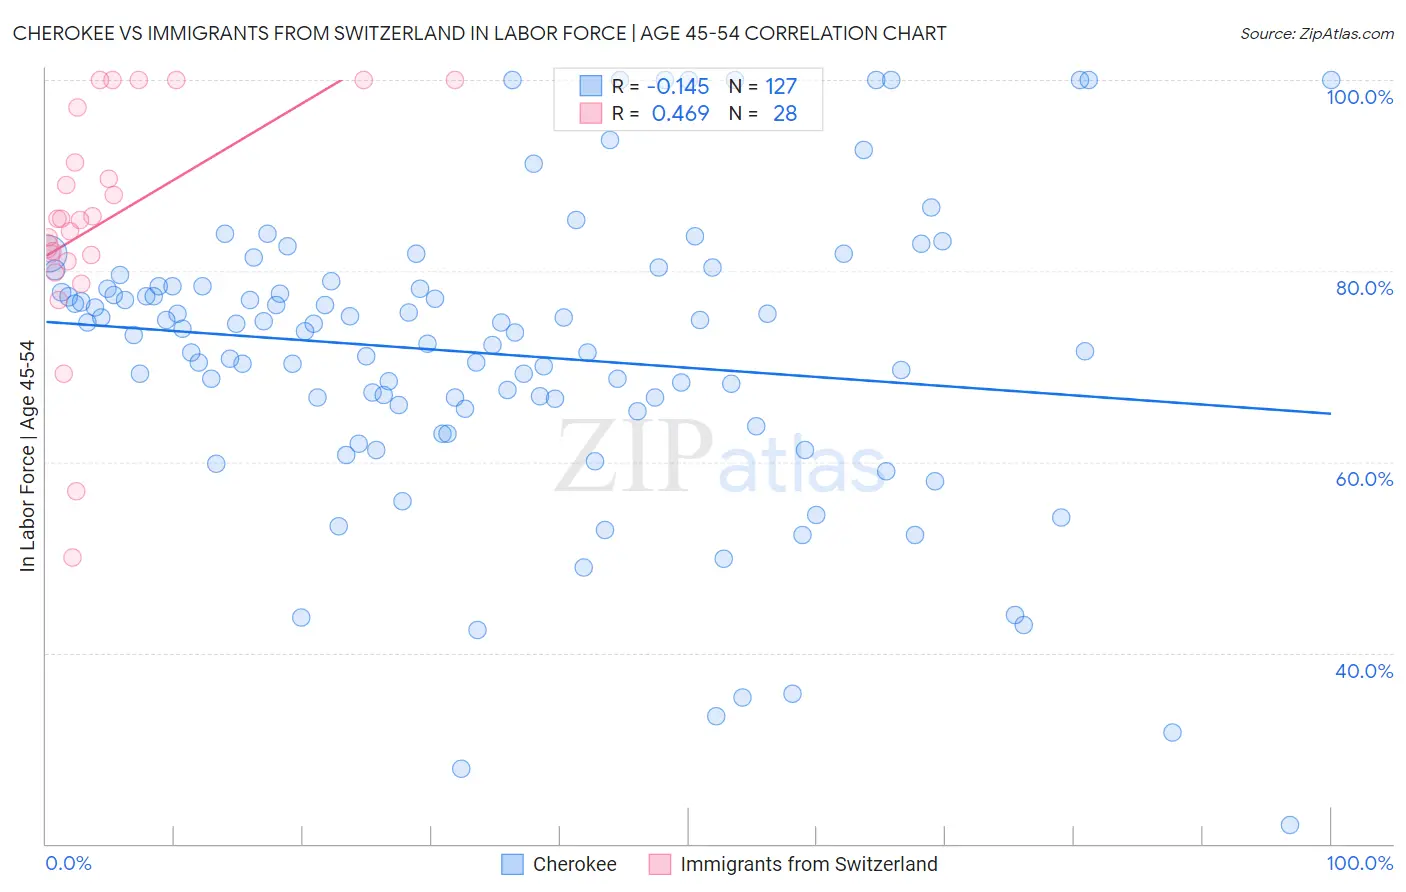
Cherokee vs Immigrants from Switzerland In Labor Force | Age 45-54 Correlation Chart
The statistical analysis conducted on geographies consisting of 493,314,993 people shows a poor negative correlation between the proportion of Cherokee and labor force participation rate among population between the ages 45 and 54 in the United States with a correlation coefficient (R) of -0.145 and weighted average of 79.0%. Similarly, the statistical analysis conducted on geographies consisting of 148,071,705 people shows a moderate positive correlation between the proportion of Immigrants from Switzerland and labor force participation rate among population between the ages 45 and 54 in the United States with a correlation coefficient (R) of 0.469 and weighted average of 82.7%, a difference of 4.7%.
In Labor Force | Age 45-54 Correlation Summary
| Measurement | Cherokee | Immigrants from Switzerland |
| Minimum | 21.9% | 50.0% |
| Maximum | 100.0% | 100.0% |
| Range | 78.1% | 50.0% |
| Mean | 71.3% | 85.2% |
| Median | 73.7% | 85.4% |
| Interquartile 25% (IQ1) | 65.6% | 81.4% |
| Interquartile 75% (IQ3) | 78.4% | 94.3% |
| Interquartile Range (IQR) | 12.8% | 12.9% |
| Standard Deviation (Sample) | 15.5% | 12.2% |
| Standard Deviation (Population) | 15.5% | 12.0% |
Similar Demographics by In Labor Force | Age 45-54
Demographics Similar to Cherokee by In Labor Force | Age 45-54
In terms of in labor force | age 45-54, the demographic groups most similar to Cherokee are Chickasaw (79.0%, a difference of 0.10%), Yaqui (78.9%, a difference of 0.10%), Comanche (79.2%, a difference of 0.28%), Yup'ik (78.6%, a difference of 0.40%), and Shoshone (79.3%, a difference of 0.41%).
| Demographics | Rating | Rank | In Labor Force | Age 45-54 |
| Immigrants | Mexico | 0.0 /100 | #312 | Tragic 79.7% |
| Colville | 0.0 /100 | #313 | Tragic 79.5% |
| Ottawa | 0.0 /100 | #314 | Tragic 79.5% |
| Blacks/African Americans | 0.0 /100 | #315 | Tragic 79.3% |
| Shoshone | 0.0 /100 | #316 | Tragic 79.3% |
| Comanche | 0.0 /100 | #317 | Tragic 79.2% |
| Chickasaw | 0.0 /100 | #318 | Tragic 79.0% |
| Cherokee | 0.0 /100 | #319 | Tragic 79.0% |
| Yaqui | 0.0 /100 | #320 | Tragic 78.9% |
| Yup'ik | 0.0 /100 | #321 | Tragic 78.6% |
| Crow | 0.0 /100 | #322 | Tragic 78.3% |
| Kiowa | 0.0 /100 | #323 | Tragic 78.3% |
| Dutch West Indians | 0.0 /100 | #324 | Tragic 78.2% |
| Choctaw | 0.0 /100 | #325 | Tragic 78.2% |
| Seminole | 0.0 /100 | #326 | Tragic 78.1% |
Demographics Similar to Immigrants from Switzerland by In Labor Force | Age 45-54
In terms of in labor force | age 45-54, the demographic groups most similar to Immigrants from Switzerland are Nigerian (82.7%, a difference of 0.010%), Hungarian (82.7%, a difference of 0.010%), Israeli (82.7%, a difference of 0.020%), Immigrants from Hungary (82.7%, a difference of 0.020%), and Immigrants from Nicaragua (82.7%, a difference of 0.050%).
| Demographics | Rating | Rank | In Labor Force | Age 45-54 |
| Icelanders | 51.8 /100 | #172 | Average 82.8% |
| Nicaraguans | 50.3 /100 | #173 | Average 82.8% |
| Costa Ricans | 50.0 /100 | #174 | Average 82.8% |
| Immigrants | Liberia | 47.9 /100 | #175 | Average 82.7% |
| Northern Europeans | 46.9 /100 | #176 | Average 82.7% |
| Immigrants | Nicaragua | 44.6 /100 | #177 | Average 82.7% |
| Nigerians | 40.5 /100 | #178 | Average 82.7% |
| Immigrants | Switzerland | 39.4 /100 | #179 | Fair 82.7% |
| Hungarians | 38.0 /100 | #180 | Fair 82.7% |
| Israelis | 37.7 /100 | #181 | Fair 82.7% |
| Immigrants | Hungary | 37.1 /100 | #182 | Fair 82.7% |
| New Zealanders | 32.7 /100 | #183 | Fair 82.6% |
| Europeans | 32.6 /100 | #184 | Fair 82.6% |
| Immigrants | England | 32.2 /100 | #185 | Fair 82.6% |
| Irish | 29.2 /100 | #186 | Fair 82.6% |