Immigrants from Czechoslovakia vs Immigrants from Switzerland In Labor Force | Age 45-54
COMPARE
Immigrants from Czechoslovakia
Immigrants from Switzerland
In Labor Force | Age 45-54
In Labor Force | Age 45-54 Comparison
Immigrants from Czechoslovakia
Immigrants from Switzerland
83.4%
IN LABOR FORCE | AGE 45-54
97.1/ 100
METRIC RATING
73rd/ 347
METRIC RANK
82.7%
IN LABOR FORCE | AGE 45-54
39.4/ 100
METRIC RATING
179th/ 347
METRIC RANK
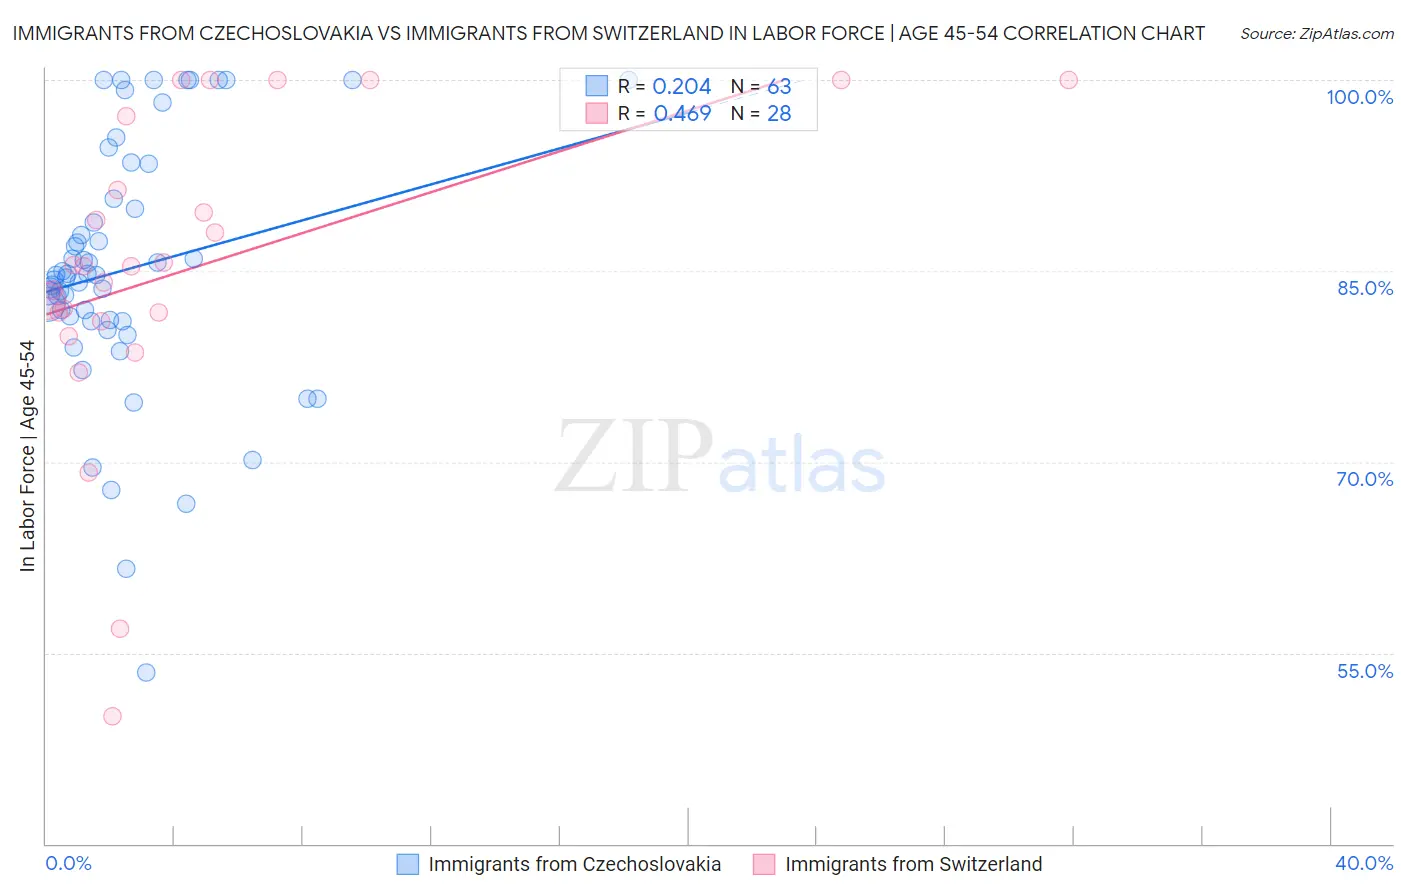
Immigrants from Czechoslovakia vs Immigrants from Switzerland In Labor Force | Age 45-54 Correlation Chart
The statistical analysis conducted on geographies consisting of 195,437,318 people shows a weak positive correlation between the proportion of Immigrants from Czechoslovakia and labor force participation rate among population between the ages 45 and 54 in the United States with a correlation coefficient (R) of 0.204 and weighted average of 83.4%. Similarly, the statistical analysis conducted on geographies consisting of 148,071,705 people shows a moderate positive correlation between the proportion of Immigrants from Switzerland and labor force participation rate among population between the ages 45 and 54 in the United States with a correlation coefficient (R) of 0.469 and weighted average of 82.7%, a difference of 0.86%.
In Labor Force | Age 45-54 Correlation Summary
| Measurement | Immigrants from Czechoslovakia | Immigrants from Switzerland |
| Minimum | 53.5% | 50.0% |
| Maximum | 100.0% | 100.0% |
| Range | 46.5% | 50.0% |
| Mean | 85.1% | 85.2% |
| Median | 84.6% | 85.4% |
| Interquartile 25% (IQ1) | 81.0% | 81.4% |
| Interquartile 75% (IQ3) | 90.7% | 94.3% |
| Interquartile Range (IQR) | 9.6% | 12.9% |
| Standard Deviation (Sample) | 9.9% | 12.2% |
| Standard Deviation (Population) | 9.8% | 12.0% |
Similar Demographics by In Labor Force | Age 45-54
Demographics Similar to Immigrants from Czechoslovakia by In Labor Force | Age 45-54
In terms of in labor force | age 45-54, the demographic groups most similar to Immigrants from Czechoslovakia are Serbian (83.4%, a difference of 0.010%), Immigrants from Somalia (83.4%, a difference of 0.010%), Estonian (83.4%, a difference of 0.010%), Immigrants from Latvia (83.4%, a difference of 0.020%), and Colombian (83.4%, a difference of 0.020%).
| Demographics | Rating | Rank | In Labor Force | Age 45-54 |
| Asians | 97.7 /100 | #66 | Exceptional 83.4% |
| Chileans | 97.7 /100 | #67 | Exceptional 83.4% |
| Immigrants | Colombia | 97.6 /100 | #68 | Exceptional 83.4% |
| Taiwanese | 97.5 /100 | #69 | Exceptional 83.4% |
| Immigrants | Latvia | 97.4 /100 | #70 | Exceptional 83.4% |
| Colombians | 97.3 /100 | #71 | Exceptional 83.4% |
| Serbians | 97.2 /100 | #72 | Exceptional 83.4% |
| Immigrants | Czechoslovakia | 97.1 /100 | #73 | Exceptional 83.4% |
| Immigrants | Somalia | 96.9 /100 | #74 | Exceptional 83.4% |
| Estonians | 96.9 /100 | #75 | Exceptional 83.4% |
| Russians | 96.8 /100 | #76 | Exceptional 83.4% |
| Cubans | 96.7 /100 | #77 | Exceptional 83.4% |
| Immigrants | Egypt | 96.6 /100 | #78 | Exceptional 83.4% |
| Belgians | 96.5 /100 | #79 | Exceptional 83.4% |
| Immigrants | Croatia | 96.5 /100 | #80 | Exceptional 83.4% |
Demographics Similar to Immigrants from Switzerland by In Labor Force | Age 45-54
In terms of in labor force | age 45-54, the demographic groups most similar to Immigrants from Switzerland are Nigerian (82.7%, a difference of 0.010%), Hungarian (82.7%, a difference of 0.010%), Israeli (82.7%, a difference of 0.020%), Immigrants from Hungary (82.7%, a difference of 0.020%), and Immigrants from Nicaragua (82.7%, a difference of 0.050%).
| Demographics | Rating | Rank | In Labor Force | Age 45-54 |
| Icelanders | 51.8 /100 | #172 | Average 82.8% |
| Nicaraguans | 50.3 /100 | #173 | Average 82.8% |
| Costa Ricans | 50.0 /100 | #174 | Average 82.8% |
| Immigrants | Liberia | 47.9 /100 | #175 | Average 82.7% |
| Northern Europeans | 46.9 /100 | #176 | Average 82.7% |
| Immigrants | Nicaragua | 44.6 /100 | #177 | Average 82.7% |
| Nigerians | 40.5 /100 | #178 | Average 82.7% |
| Immigrants | Switzerland | 39.4 /100 | #179 | Fair 82.7% |
| Hungarians | 38.0 /100 | #180 | Fair 82.7% |
| Israelis | 37.7 /100 | #181 | Fair 82.7% |
| Immigrants | Hungary | 37.1 /100 | #182 | Fair 82.7% |
| New Zealanders | 32.7 /100 | #183 | Fair 82.6% |
| Europeans | 32.6 /100 | #184 | Fair 82.6% |
| Immigrants | England | 32.2 /100 | #185 | Fair 82.6% |
| Irish | 29.2 /100 | #186 | Fair 82.6% |