Panamanian vs Immigrants from Switzerland Master's Degree
COMPARE
Panamanian
Immigrants from Switzerland
Master's Degree
Master's Degree Comparison
Panamanians
Immigrants from Switzerland
14.4%
MASTER'S DEGREE
25.1/ 100
METRIC RATING
200th/ 347
METRIC RANK
20.9%
MASTER'S DEGREE
100.0/ 100
METRIC RATING
14th/ 347
METRIC RANK
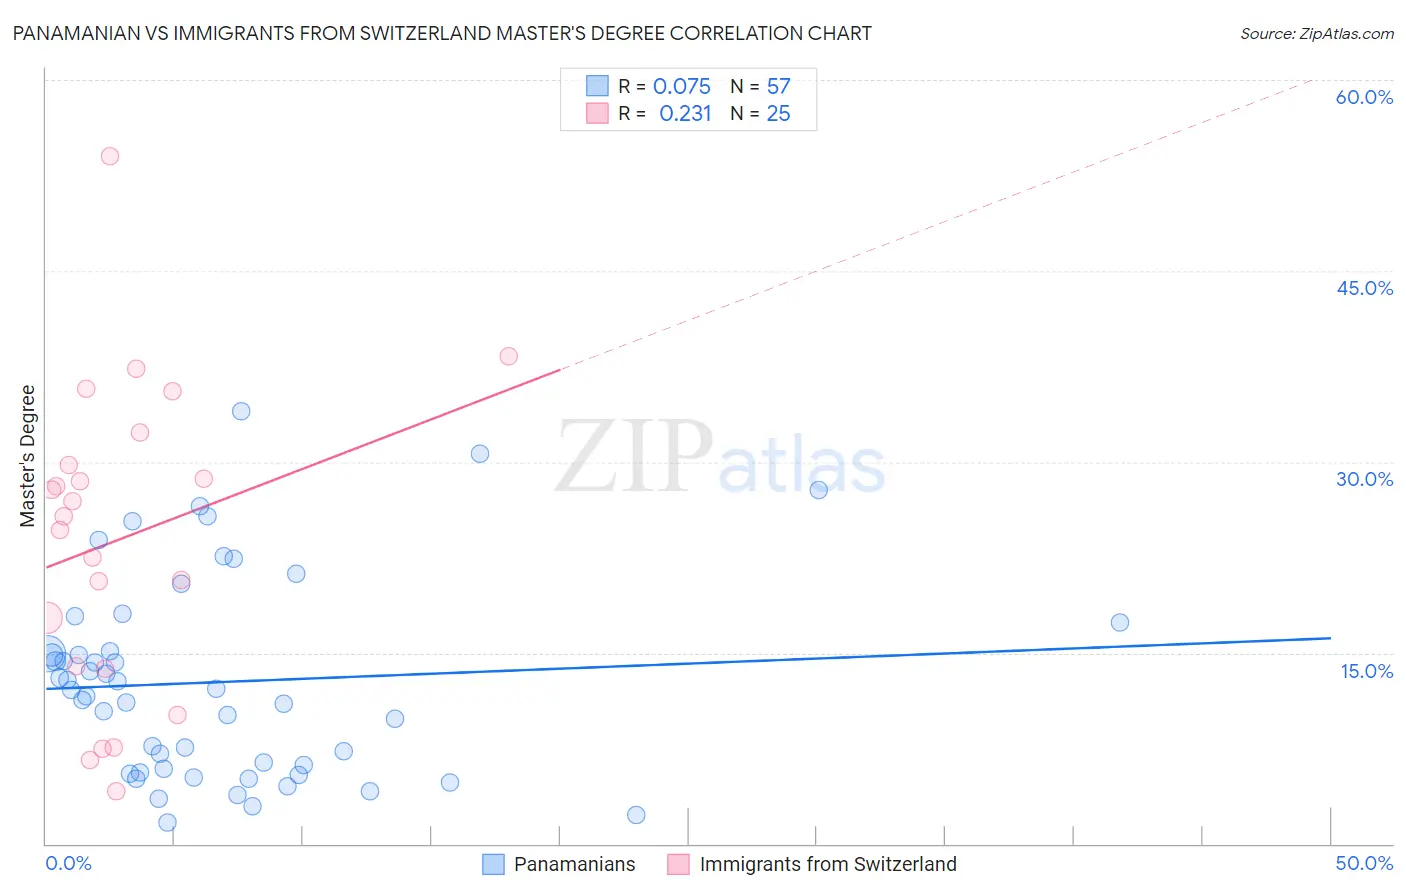
Panamanian vs Immigrants from Switzerland Master's Degree Correlation Chart
The statistical analysis conducted on geographies consisting of 281,151,832 people shows a slight positive correlation between the proportion of Panamanians and percentage of population with at least master's degree education in the United States with a correlation coefficient (R) of 0.075 and weighted average of 14.4%. Similarly, the statistical analysis conducted on geographies consisting of 148,079,406 people shows a weak positive correlation between the proportion of Immigrants from Switzerland and percentage of population with at least master's degree education in the United States with a correlation coefficient (R) of 0.231 and weighted average of 20.9%, a difference of 44.9%.
Master's Degree Correlation Summary
| Measurement | Panamanian | Immigrants from Switzerland |
| Minimum | 1.6% | 4.1% |
| Maximum | 33.9% | 54.0% |
| Range | 32.3% | 50.0% |
| Mean | 12.7% | 23.9% |
| Median | 12.1% | 25.7% |
| Interquartile 25% (IQ1) | 5.7% | 13.9% |
| Interquartile 75% (IQ3) | 16.3% | 31.0% |
| Interquartile Range (IQR) | 10.5% | 17.2% |
| Standard Deviation (Sample) | 7.8% | 12.0% |
| Standard Deviation (Population) | 7.7% | 11.7% |
Similar Demographics by Master's Degree
Demographics Similar to Panamanians by Master's Degree
In terms of master's degree, the demographic groups most similar to Panamanians are Scotch-Irish (14.4%, a difference of 0.010%), Immigrants from Western Africa (14.4%, a difference of 0.020%), Yugoslavian (14.4%, a difference of 0.13%), French (14.4%, a difference of 0.25%), and Trinidadian and Tobagonian (14.4%, a difference of 0.28%).
| Demographics | Rating | Rank | Master's Degree |
| Immigrants | Nigeria | 32.7 /100 | #193 | Fair 14.6% |
| Chinese | 32.5 /100 | #194 | Fair 14.6% |
| Danes | 31.3 /100 | #195 | Fair 14.5% |
| Czechoslovakians | 29.9 /100 | #196 | Fair 14.5% |
| Belgians | 28.0 /100 | #197 | Fair 14.5% |
| West Indians | 27.4 /100 | #198 | Fair 14.5% |
| Immigrants | Armenia | 27.2 /100 | #199 | Fair 14.5% |
| Panamanians | 25.1 /100 | #200 | Fair 14.4% |
| Scotch-Irish | 25.0 /100 | #201 | Fair 14.4% |
| Immigrants | Western Africa | 24.9 /100 | #202 | Fair 14.4% |
| Yugoslavians | 24.3 /100 | #203 | Fair 14.4% |
| French | 23.7 /100 | #204 | Fair 14.4% |
| Trinidadians and Tobagonians | 23.5 /100 | #205 | Fair 14.4% |
| Scandinavians | 23.3 /100 | #206 | Fair 14.4% |
| Immigrants | Bosnia and Herzegovina | 22.0 /100 | #207 | Fair 14.3% |
Demographics Similar to Immigrants from Switzerland by Master's Degree
In terms of master's degree, the demographic groups most similar to Immigrants from Switzerland are Immigrants from Australia (20.9%, a difference of 0.010%), Immigrants from Eastern Asia (20.8%, a difference of 0.18%), Immigrants from Belgium (20.8%, a difference of 0.47%), Immigrants from South Central Asia (20.7%, a difference of 0.73%), and Eastern European (21.1%, a difference of 1.2%).
| Demographics | Rating | Rank | Master's Degree |
| Iranians | 100.0 /100 | #7 | Exceptional 22.3% |
| Cypriots | 100.0 /100 | #8 | Exceptional 21.8% |
| Thais | 100.0 /100 | #9 | Exceptional 21.7% |
| Immigrants | Iran | 100.0 /100 | #10 | Exceptional 21.6% |
| Immigrants | China | 100.0 /100 | #11 | Exceptional 21.2% |
| Eastern Europeans | 100.0 /100 | #12 | Exceptional 21.1% |
| Immigrants | Australia | 100.0 /100 | #13 | Exceptional 20.9% |
| Immigrants | Switzerland | 100.0 /100 | #14 | Exceptional 20.9% |
| Immigrants | Eastern Asia | 100.0 /100 | #15 | Exceptional 20.8% |
| Immigrants | Belgium | 100.0 /100 | #16 | Exceptional 20.8% |
| Immigrants | South Central Asia | 100.0 /100 | #17 | Exceptional 20.7% |
| Soviet Union | 100.0 /100 | #18 | Exceptional 20.5% |
| Immigrants | Hong Kong | 100.0 /100 | #19 | Exceptional 20.5% |
| Indians (Asian) | 100.0 /100 | #20 | Exceptional 20.5% |
| Immigrants | Ireland | 100.0 /100 | #21 | Exceptional 20.4% |