Panamanian vs Immigrants from Switzerland In Labor Force | Age 20-24
COMPARE
Panamanian
Immigrants from Switzerland
In Labor Force | Age 20-24
In Labor Force | Age 20-24 Comparison
Panamanians
Immigrants from Switzerland
74.7%
IN LABOR FORCE | AGE 20-24
25.0/ 100
METRIC RATING
197th/ 347
METRIC RANK
74.2%
IN LABOR FORCE | AGE 20-24
4.1/ 100
METRIC RATING
232nd/ 347
METRIC RANK
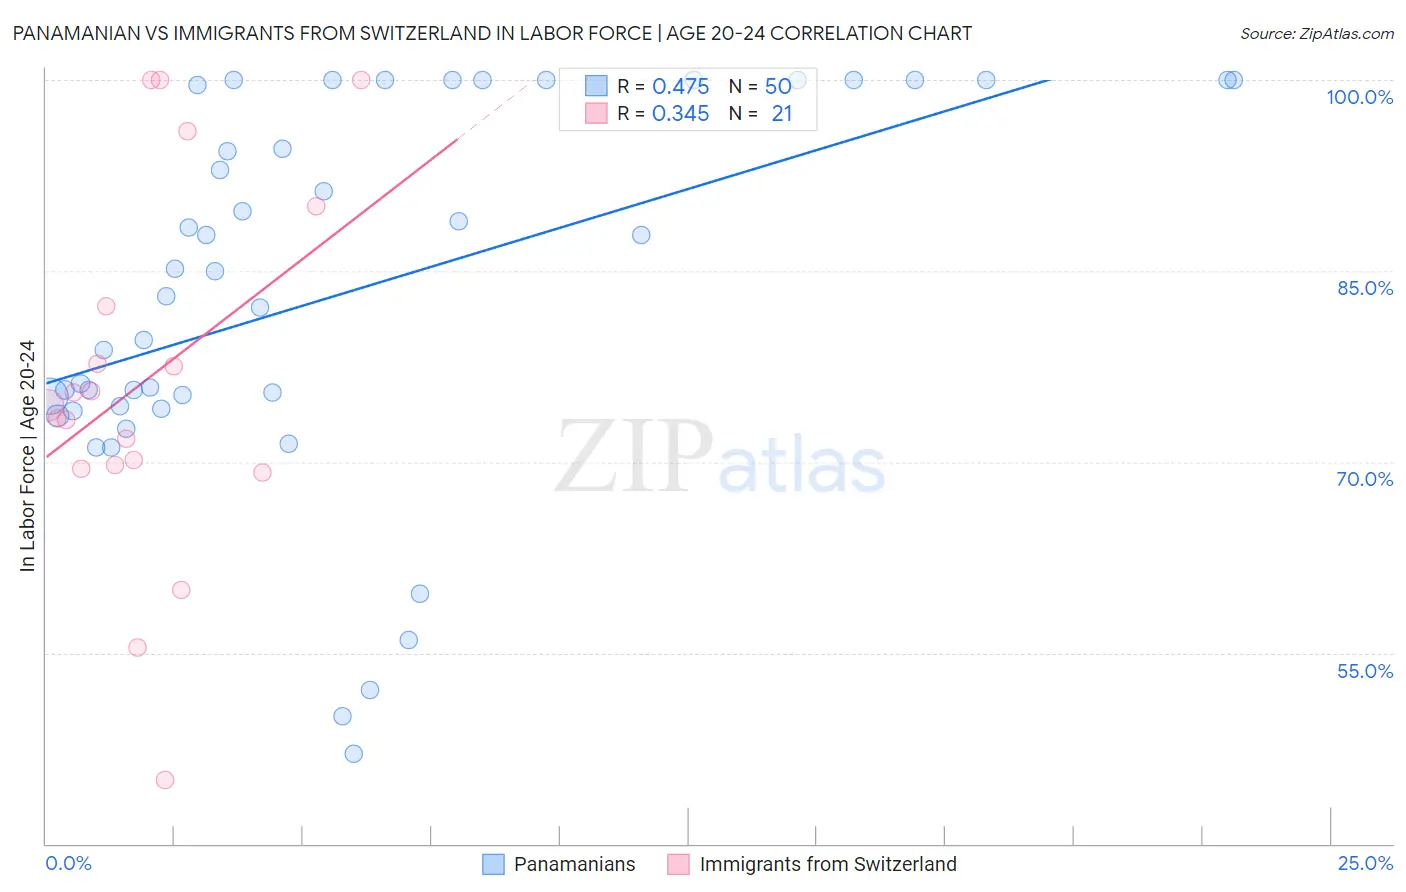
Panamanian vs Immigrants from Switzerland In Labor Force | Age 20-24 Correlation Chart
The statistical analysis conducted on geographies consisting of 281,211,194 people shows a moderate positive correlation between the proportion of Panamanians and labor force participation rate among population between the ages 20 and 24 in the United States with a correlation coefficient (R) of 0.475 and weighted average of 74.7%. Similarly, the statistical analysis conducted on geographies consisting of 148,049,599 people shows a mild positive correlation between the proportion of Immigrants from Switzerland and labor force participation rate among population between the ages 20 and 24 in the United States with a correlation coefficient (R) of 0.345 and weighted average of 74.2%, a difference of 0.76%.
In Labor Force | Age 20-24 Correlation Summary
| Measurement | Panamanian | Immigrants from Switzerland |
| Minimum | 47.0% | 45.0% |
| Maximum | 100.0% | 100.0% |
| Range | 53.0% | 55.0% |
| Mean | 83.2% | 76.5% |
| Median | 84.0% | 74.4% |
| Interquartile 25% (IQ1) | 74.4% | 69.6% |
| Interquartile 75% (IQ3) | 100.0% | 86.1% |
| Interquartile Range (IQR) | 25.6% | 16.5% |
| Standard Deviation (Sample) | 14.7% | 14.5% |
| Standard Deviation (Population) | 14.5% | 14.1% |
Similar Demographics by In Labor Force | Age 20-24
Demographics Similar to Panamanians by In Labor Force | Age 20-24
In terms of in labor force | age 20-24, the demographic groups most similar to Panamanians are Immigrants from Vietnam (74.7%, a difference of 0.0%), Immigrants from Denmark (74.8%, a difference of 0.010%), Eastern European (74.8%, a difference of 0.010%), Immigrants from Nigeria (74.7%, a difference of 0.020%), and Alsatian (74.8%, a difference of 0.040%).
| Demographics | Rating | Rank | In Labor Force | Age 20-24 |
| Russians | 32.2 /100 | #190 | Fair 74.8% |
| Senegalese | 28.1 /100 | #191 | Fair 74.8% |
| Immigrants | Europe | 27.5 /100 | #192 | Fair 74.8% |
| Alsatians | 27.1 /100 | #193 | Fair 74.8% |
| Immigrants | Denmark | 25.8 /100 | #194 | Fair 74.8% |
| Eastern Europeans | 25.4 /100 | #195 | Fair 74.8% |
| Immigrants | Vietnam | 25.1 /100 | #196 | Fair 74.7% |
| Panamanians | 25.0 /100 | #197 | Fair 74.7% |
| Immigrants | Nigeria | 24.2 /100 | #198 | Fair 74.7% |
| Taiwanese | 23.2 /100 | #199 | Fair 74.7% |
| Nigerians | 21.9 /100 | #200 | Fair 74.7% |
| Choctaw | 21.4 /100 | #201 | Fair 74.7% |
| Moroccans | 20.4 /100 | #202 | Fair 74.7% |
| Immigrants | Northern Africa | 17.9 /100 | #203 | Poor 74.6% |
| Immigrants | Italy | 17.6 /100 | #204 | Poor 74.6% |
Demographics Similar to Immigrants from Switzerland by In Labor Force | Age 20-24
In terms of in labor force | age 20-24, the demographic groups most similar to Immigrants from Switzerland are Immigrants from Greece (74.2%, a difference of 0.010%), Immigrants from Albania (74.2%, a difference of 0.020%), Immigrants from Chile (74.1%, a difference of 0.040%), Immigrants from Sweden (74.2%, a difference of 0.050%), and Immigrants (74.1%, a difference of 0.050%).
| Demographics | Rating | Rank | In Labor Force | Age 20-24 |
| Ghanaians | 6.2 /100 | #225 | Tragic 74.3% |
| Immigrants | Fiji | 5.9 /100 | #226 | Tragic 74.3% |
| Immigrants | Ireland | 5.8 /100 | #227 | Tragic 74.3% |
| Immigrants | Ukraine | 5.1 /100 | #228 | Tragic 74.2% |
| Immigrants | Sweden | 4.6 /100 | #229 | Tragic 74.2% |
| Immigrants | Albania | 4.3 /100 | #230 | Tragic 74.2% |
| Immigrants | Greece | 4.1 /100 | #231 | Tragic 74.2% |
| Immigrants | Switzerland | 4.1 /100 | #232 | Tragic 74.2% |
| Immigrants | Chile | 3.7 /100 | #233 | Tragic 74.1% |
| Immigrants | Immigrants | 3.6 /100 | #234 | Tragic 74.1% |
| Laotians | 3.5 /100 | #235 | Tragic 74.1% |
| Immigrants | France | 3.3 /100 | #236 | Tragic 74.1% |
| Bermudans | 3.2 /100 | #237 | Tragic 74.1% |
| Immigrants | Japan | 3.0 /100 | #238 | Tragic 74.1% |
| Immigrants | Latin America | 2.7 /100 | #239 | Tragic 74.1% |