Panamanian vs Immigrants from Trinidad and Tobago In Labor Force | Age 20-24
COMPARE
Panamanian
Immigrants from Trinidad and Tobago
In Labor Force | Age 20-24
In Labor Force | Age 20-24 Comparison
Panamanians
Immigrants from Trinidad and Tobago
74.7%
IN LABOR FORCE | AGE 20-24
25.0/ 100
METRIC RATING
197th/ 347
METRIC RANK
71.1%
IN LABOR FORCE | AGE 20-24
0.0/ 100
METRIC RATING
327th/ 347
METRIC RANK
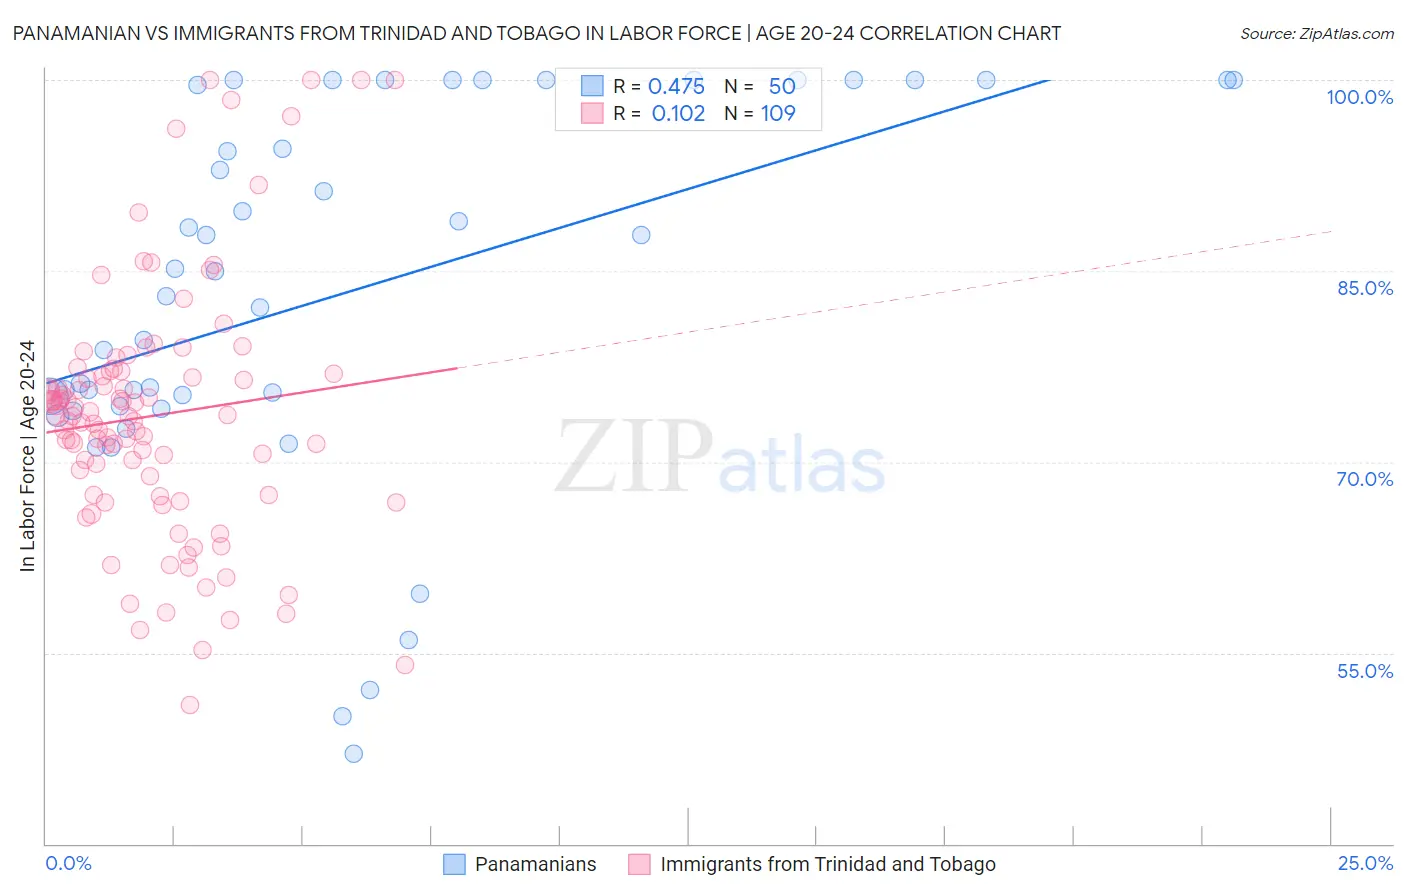
Panamanian vs Immigrants from Trinidad and Tobago In Labor Force | Age 20-24 Correlation Chart
The statistical analysis conducted on geographies consisting of 281,211,194 people shows a moderate positive correlation between the proportion of Panamanians and labor force participation rate among population between the ages 20 and 24 in the United States with a correlation coefficient (R) of 0.475 and weighted average of 74.7%. Similarly, the statistical analysis conducted on geographies consisting of 223,471,957 people shows a poor positive correlation between the proportion of Immigrants from Trinidad and Tobago and labor force participation rate among population between the ages 20 and 24 in the United States with a correlation coefficient (R) of 0.102 and weighted average of 71.1%, a difference of 5.2%.
In Labor Force | Age 20-24 Correlation Summary
| Measurement | Panamanian | Immigrants from Trinidad and Tobago |
| Minimum | 47.0% | 50.9% |
| Maximum | 100.0% | 100.0% |
| Range | 53.0% | 49.1% |
| Mean | 83.2% | 73.6% |
| Median | 84.0% | 73.6% |
| Interquartile 25% (IQ1) | 74.4% | 67.4% |
| Interquartile 75% (IQ3) | 100.0% | 77.0% |
| Interquartile Range (IQR) | 25.6% | 9.6% |
| Standard Deviation (Sample) | 14.7% | 10.0% |
| Standard Deviation (Population) | 14.5% | 9.9% |
Similar Demographics by In Labor Force | Age 20-24
Demographics Similar to Panamanians by In Labor Force | Age 20-24
In terms of in labor force | age 20-24, the demographic groups most similar to Panamanians are Immigrants from Vietnam (74.7%, a difference of 0.0%), Immigrants from Denmark (74.8%, a difference of 0.010%), Eastern European (74.8%, a difference of 0.010%), Immigrants from Nigeria (74.7%, a difference of 0.020%), and Alsatian (74.8%, a difference of 0.040%).
| Demographics | Rating | Rank | In Labor Force | Age 20-24 |
| Russians | 32.2 /100 | #190 | Fair 74.8% |
| Senegalese | 28.1 /100 | #191 | Fair 74.8% |
| Immigrants | Europe | 27.5 /100 | #192 | Fair 74.8% |
| Alsatians | 27.1 /100 | #193 | Fair 74.8% |
| Immigrants | Denmark | 25.8 /100 | #194 | Fair 74.8% |
| Eastern Europeans | 25.4 /100 | #195 | Fair 74.8% |
| Immigrants | Vietnam | 25.1 /100 | #196 | Fair 74.7% |
| Panamanians | 25.0 /100 | #197 | Fair 74.7% |
| Immigrants | Nigeria | 24.2 /100 | #198 | Fair 74.7% |
| Taiwanese | 23.2 /100 | #199 | Fair 74.7% |
| Nigerians | 21.9 /100 | #200 | Fair 74.7% |
| Choctaw | 21.4 /100 | #201 | Fair 74.7% |
| Moroccans | 20.4 /100 | #202 | Fair 74.7% |
| Immigrants | Northern Africa | 17.9 /100 | #203 | Poor 74.6% |
| Immigrants | Italy | 17.6 /100 | #204 | Poor 74.6% |
Demographics Similar to Immigrants from Trinidad and Tobago by In Labor Force | Age 20-24
In terms of in labor force | age 20-24, the demographic groups most similar to Immigrants from Trinidad and Tobago are Dominican (71.1%, a difference of 0.0%), Immigrants from China (71.1%, a difference of 0.020%), Barbadian (71.1%, a difference of 0.090%), Immigrants from Dominican Republic (71.2%, a difference of 0.19%), and Yup'ik (70.9%, a difference of 0.26%).
| Demographics | Rating | Rank | In Labor Force | Age 20-24 |
| Trinidadians and Tobagonians | 0.0 /100 | #320 | Tragic 71.5% |
| Immigrants | Taiwan | 0.0 /100 | #321 | Tragic 71.5% |
| Filipinos | 0.0 /100 | #322 | Tragic 71.4% |
| West Indians | 0.0 /100 | #323 | Tragic 71.3% |
| Immigrants | Dominican Republic | 0.0 /100 | #324 | Tragic 71.2% |
| Barbadians | 0.0 /100 | #325 | Tragic 71.1% |
| Dominicans | 0.0 /100 | #326 | Tragic 71.1% |
| Immigrants | Trinidad and Tobago | 0.0 /100 | #327 | Tragic 71.1% |
| Immigrants | China | 0.0 /100 | #328 | Tragic 71.1% |
| Yup'ik | 0.0 /100 | #329 | Tragic 70.9% |
| Vietnamese | 0.0 /100 | #330 | Tragic 70.6% |
| Immigrants | Bangladesh | 0.0 /100 | #331 | Tragic 70.6% |
| Immigrants | Uzbekistan | 0.0 /100 | #332 | Tragic 70.4% |
| Yuman | 0.0 /100 | #333 | Tragic 70.3% |
| British West Indians | 0.0 /100 | #334 | Tragic 70.0% |