Panamanian vs Ute In Labor Force | Age 20-24
COMPARE
Panamanian
Ute
In Labor Force | Age 20-24
In Labor Force | Age 20-24 Comparison
Panamanians
Ute
74.7%
IN LABOR FORCE | AGE 20-24
25.0/ 100
METRIC RATING
197th/ 347
METRIC RANK
73.8%
IN LABOR FORCE | AGE 20-24
1.0/ 100
METRIC RATING
254th/ 347
METRIC RANK
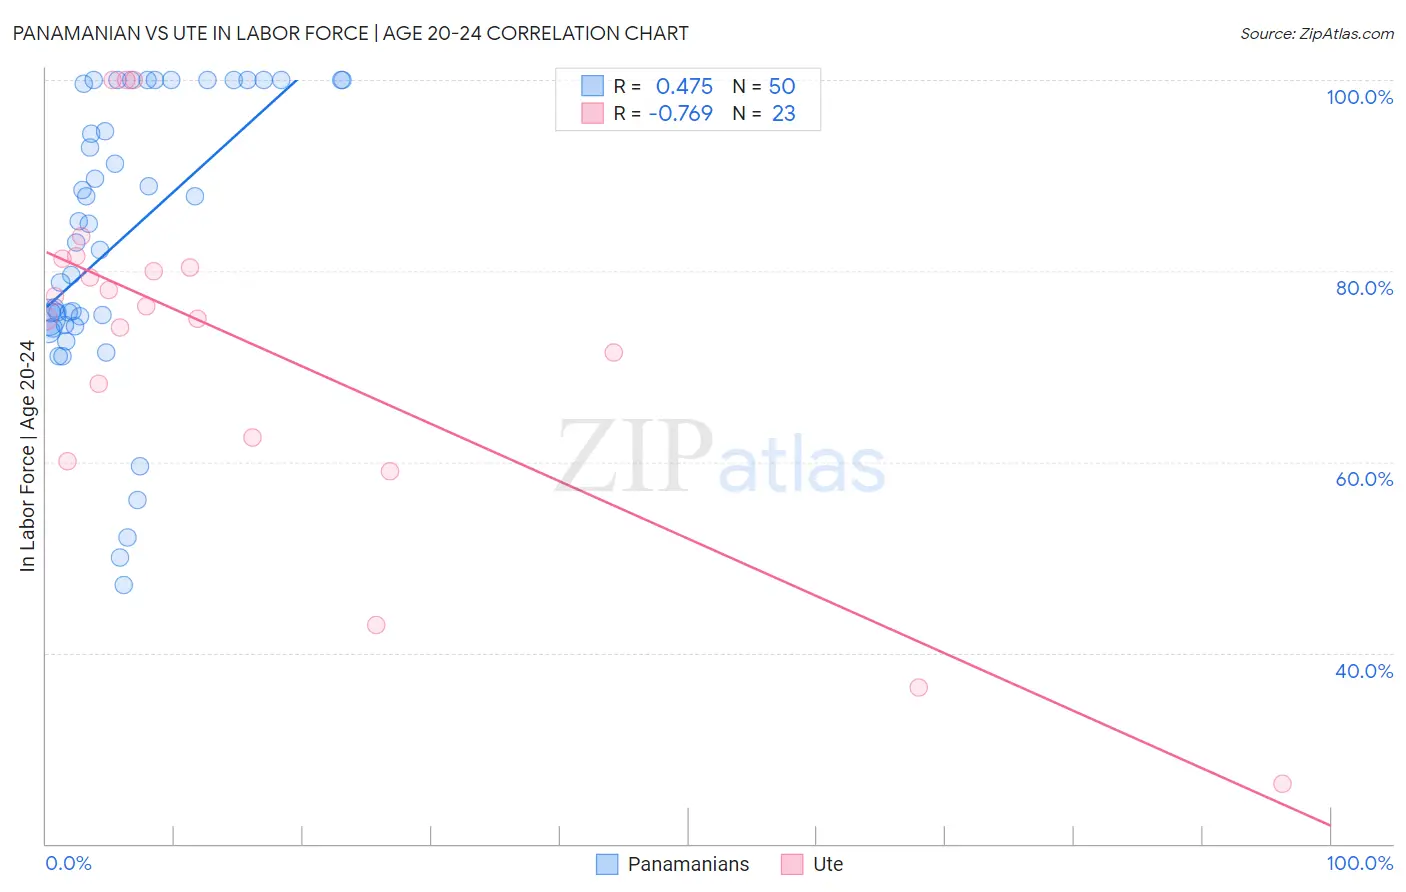
Panamanian vs Ute In Labor Force | Age 20-24 Correlation Chart
The statistical analysis conducted on geographies consisting of 281,211,194 people shows a moderate positive correlation between the proportion of Panamanians and labor force participation rate among population between the ages 20 and 24 in the United States with a correlation coefficient (R) of 0.475 and weighted average of 74.7%. Similarly, the statistical analysis conducted on geographies consisting of 55,663,255 people shows a strong negative correlation between the proportion of Ute and labor force participation rate among population between the ages 20 and 24 in the United States with a correlation coefficient (R) of -0.769 and weighted average of 73.8%, a difference of 1.3%.
In Labor Force | Age 20-24 Correlation Summary
| Measurement | Panamanian | Ute |
| Minimum | 47.0% | 26.3% |
| Maximum | 100.0% | 100.0% |
| Range | 53.0% | 73.7% |
| Mean | 83.2% | 72.5% |
| Median | 84.0% | 76.4% |
| Interquartile 25% (IQ1) | 74.4% | 62.5% |
| Interquartile 75% (IQ3) | 100.0% | 81.3% |
| Interquartile Range (IQR) | 25.6% | 18.8% |
| Standard Deviation (Sample) | 14.7% | 18.6% |
| Standard Deviation (Population) | 14.5% | 18.1% |
Similar Demographics by In Labor Force | Age 20-24
Demographics Similar to Panamanians by In Labor Force | Age 20-24
In terms of in labor force | age 20-24, the demographic groups most similar to Panamanians are Immigrants from Vietnam (74.7%, a difference of 0.0%), Immigrants from Denmark (74.8%, a difference of 0.010%), Eastern European (74.8%, a difference of 0.010%), Immigrants from Nigeria (74.7%, a difference of 0.020%), and Alsatian (74.8%, a difference of 0.040%).
| Demographics | Rating | Rank | In Labor Force | Age 20-24 |
| Russians | 32.2 /100 | #190 | Fair 74.8% |
| Senegalese | 28.1 /100 | #191 | Fair 74.8% |
| Immigrants | Europe | 27.5 /100 | #192 | Fair 74.8% |
| Alsatians | 27.1 /100 | #193 | Fair 74.8% |
| Immigrants | Denmark | 25.8 /100 | #194 | Fair 74.8% |
| Eastern Europeans | 25.4 /100 | #195 | Fair 74.8% |
| Immigrants | Vietnam | 25.1 /100 | #196 | Fair 74.7% |
| Panamanians | 25.0 /100 | #197 | Fair 74.7% |
| Immigrants | Nigeria | 24.2 /100 | #198 | Fair 74.7% |
| Taiwanese | 23.2 /100 | #199 | Fair 74.7% |
| Nigerians | 21.9 /100 | #200 | Fair 74.7% |
| Choctaw | 21.4 /100 | #201 | Fair 74.7% |
| Moroccans | 20.4 /100 | #202 | Fair 74.7% |
| Immigrants | Northern Africa | 17.9 /100 | #203 | Poor 74.6% |
| Immigrants | Italy | 17.6 /100 | #204 | Poor 74.6% |
Demographics Similar to Ute by In Labor Force | Age 20-24
In terms of in labor force | age 20-24, the demographic groups most similar to Ute are Arapaho (73.8%, a difference of 0.0%), Immigrants from Pakistan (73.8%, a difference of 0.020%), Immigrants from Kazakhstan (73.8%, a difference of 0.050%), Immigrants from Egypt (73.8%, a difference of 0.070%), and Spanish American Indian (73.7%, a difference of 0.070%).
| Demographics | Rating | Rank | In Labor Force | Age 20-24 |
| Colville | 1.5 /100 | #247 | Tragic 73.9% |
| Immigrants | Saudi Arabia | 1.5 /100 | #248 | Tragic 73.9% |
| Blacks/African Americans | 1.3 /100 | #249 | Tragic 73.9% |
| Immigrants | Belgium | 1.3 /100 | #250 | Tragic 73.9% |
| Immigrants | Egypt | 1.2 /100 | #251 | Tragic 73.8% |
| Immigrants | Kazakhstan | 1.1 /100 | #252 | Tragic 73.8% |
| Arapaho | 1.0 /100 | #253 | Tragic 73.8% |
| Ute | 1.0 /100 | #254 | Tragic 73.8% |
| Immigrants | Pakistan | 0.9 /100 | #255 | Tragic 73.8% |
| Spanish American Indians | 0.8 /100 | #256 | Tragic 73.7% |
| Paraguayans | 0.8 /100 | #257 | Tragic 73.7% |
| Egyptians | 0.7 /100 | #258 | Tragic 73.7% |
| Dutch West Indians | 0.7 /100 | #259 | Tragic 73.7% |
| Immigrants | Turkey | 0.7 /100 | #260 | Tragic 73.7% |
| Houma | 0.6 /100 | #261 | Tragic 73.7% |