Pakistani vs Immigrants from Switzerland In Labor Force | Age 20-24
COMPARE
Pakistani
Immigrants from Switzerland
In Labor Force | Age 20-24
In Labor Force | Age 20-24 Comparison
Pakistanis
Immigrants from Switzerland
75.8%
IN LABOR FORCE | AGE 20-24
94.1/ 100
METRIC RATING
122nd/ 347
METRIC RANK
74.2%
IN LABOR FORCE | AGE 20-24
4.1/ 100
METRIC RATING
232nd/ 347
METRIC RANK
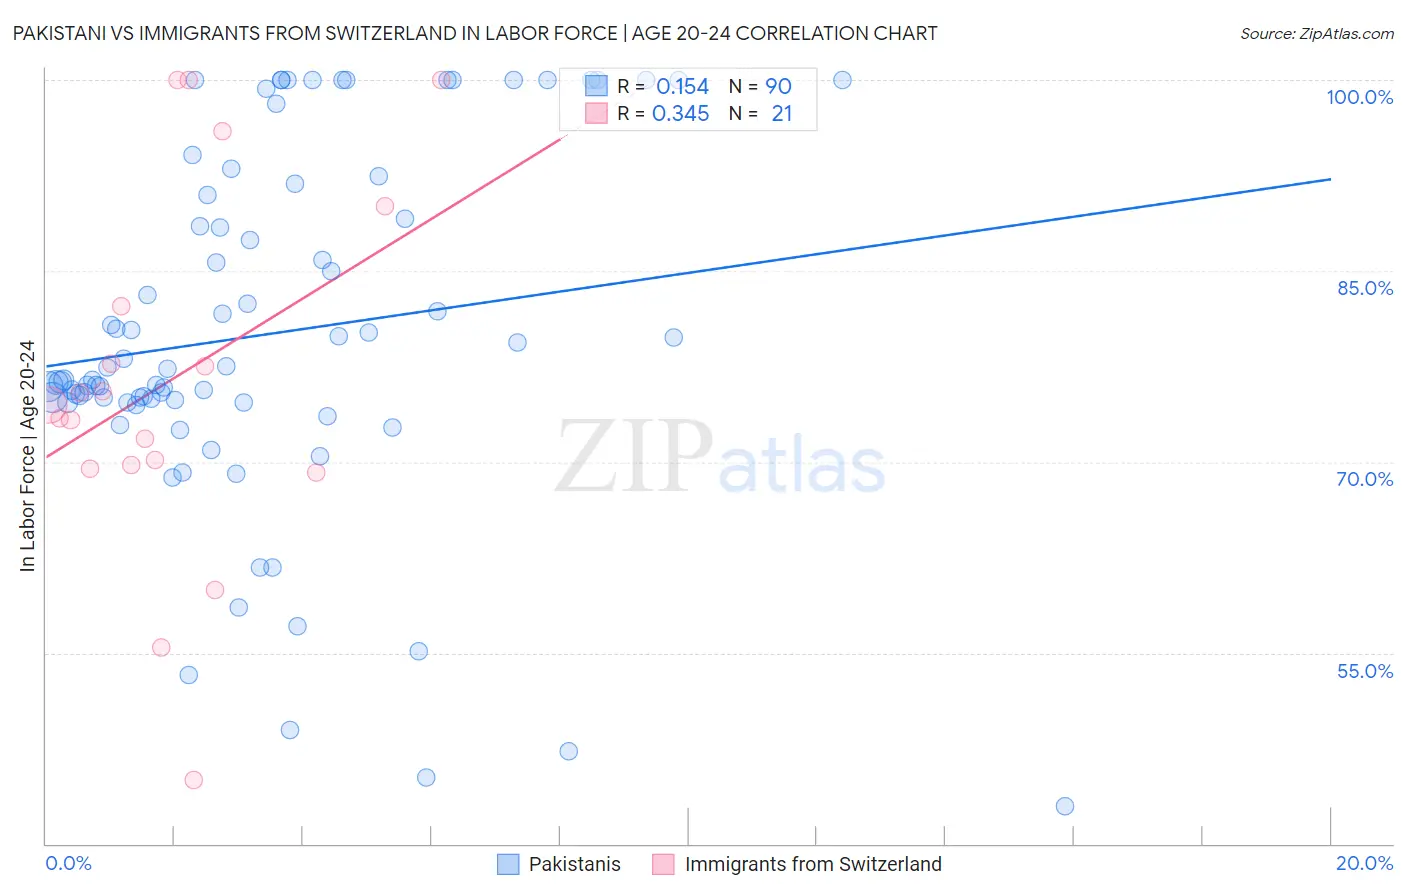
Pakistani vs Immigrants from Switzerland In Labor Force | Age 20-24 Correlation Chart
The statistical analysis conducted on geographies consisting of 335,293,988 people shows a poor positive correlation between the proportion of Pakistanis and labor force participation rate among population between the ages 20 and 24 in the United States with a correlation coefficient (R) of 0.154 and weighted average of 75.8%. Similarly, the statistical analysis conducted on geographies consisting of 148,049,599 people shows a mild positive correlation between the proportion of Immigrants from Switzerland and labor force participation rate among population between the ages 20 and 24 in the United States with a correlation coefficient (R) of 0.345 and weighted average of 74.2%, a difference of 2.2%.
In Labor Force | Age 20-24 Correlation Summary
| Measurement | Pakistani | Immigrants from Switzerland |
| Minimum | 42.9% | 45.0% |
| Maximum | 100.0% | 100.0% |
| Range | 57.1% | 55.0% |
| Mean | 80.0% | 76.5% |
| Median | 76.9% | 74.4% |
| Interquartile 25% (IQ1) | 74.7% | 69.6% |
| Interquartile 75% (IQ3) | 90.9% | 86.1% |
| Interquartile Range (IQR) | 16.2% | 16.5% |
| Standard Deviation (Sample) | 13.9% | 14.5% |
| Standard Deviation (Population) | 13.8% | 14.1% |
Similar Demographics by In Labor Force | Age 20-24
Demographics Similar to Pakistanis by In Labor Force | Age 20-24
In terms of in labor force | age 20-24, the demographic groups most similar to Pakistanis are Immigrants from Bulgaria (75.8%, a difference of 0.0%), Immigrants from Serbia (75.8%, a difference of 0.010%), Immigrants from Sierra Leone (75.8%, a difference of 0.020%), Immigrants from Africa (75.8%, a difference of 0.030%), and Immigrants from Scotland (75.8%, a difference of 0.030%).
| Demographics | Rating | Rank | In Labor Force | Age 20-24 |
| Alaska Natives | 95.1 /100 | #115 | Exceptional 75.9% |
| Immigrants | North America | 95.0 /100 | #116 | Exceptional 75.9% |
| Assyrians/Chaldeans/Syriacs | 94.9 /100 | #117 | Exceptional 75.9% |
| Spanish Americans | 94.8 /100 | #118 | Exceptional 75.8% |
| Immigrants | Portugal | 94.8 /100 | #119 | Exceptional 75.8% |
| Immigrants | Africa | 94.6 /100 | #120 | Exceptional 75.8% |
| Immigrants | Serbia | 94.3 /100 | #121 | Exceptional 75.8% |
| Pakistanis | 94.1 /100 | #122 | Exceptional 75.8% |
| Immigrants | Bulgaria | 94.1 /100 | #123 | Exceptional 75.8% |
| Immigrants | Sierra Leone | 93.8 /100 | #124 | Exceptional 75.8% |
| Immigrants | Scotland | 93.7 /100 | #125 | Exceptional 75.8% |
| Brazilians | 93.0 /100 | #126 | Exceptional 75.8% |
| Sub-Saharan Africans | 90.9 /100 | #127 | Exceptional 75.7% |
| Immigrants | Afghanistan | 89.4 /100 | #128 | Excellent 75.6% |
| Iroquois | 89.1 /100 | #129 | Excellent 75.6% |
Demographics Similar to Immigrants from Switzerland by In Labor Force | Age 20-24
In terms of in labor force | age 20-24, the demographic groups most similar to Immigrants from Switzerland are Immigrants from Greece (74.2%, a difference of 0.010%), Immigrants from Albania (74.2%, a difference of 0.020%), Immigrants from Chile (74.1%, a difference of 0.040%), Immigrants from Sweden (74.2%, a difference of 0.050%), and Immigrants (74.1%, a difference of 0.050%).
| Demographics | Rating | Rank | In Labor Force | Age 20-24 |
| Ghanaians | 6.2 /100 | #225 | Tragic 74.3% |
| Immigrants | Fiji | 5.9 /100 | #226 | Tragic 74.3% |
| Immigrants | Ireland | 5.8 /100 | #227 | Tragic 74.3% |
| Immigrants | Ukraine | 5.1 /100 | #228 | Tragic 74.2% |
| Immigrants | Sweden | 4.6 /100 | #229 | Tragic 74.2% |
| Immigrants | Albania | 4.3 /100 | #230 | Tragic 74.2% |
| Immigrants | Greece | 4.1 /100 | #231 | Tragic 74.2% |
| Immigrants | Switzerland | 4.1 /100 | #232 | Tragic 74.2% |
| Immigrants | Chile | 3.7 /100 | #233 | Tragic 74.1% |
| Immigrants | Immigrants | 3.6 /100 | #234 | Tragic 74.1% |
| Laotians | 3.5 /100 | #235 | Tragic 74.1% |
| Immigrants | France | 3.3 /100 | #236 | Tragic 74.1% |
| Bermudans | 3.2 /100 | #237 | Tragic 74.1% |
| Immigrants | Japan | 3.0 /100 | #238 | Tragic 74.1% |
| Immigrants | Latin America | 2.7 /100 | #239 | Tragic 74.1% |