Palestinian vs Egyptian In Labor Force | Age 20-64
COMPARE
Palestinian
Egyptian
In Labor Force | Age 20-64
In Labor Force | Age 20-64 Comparison
Palestinians
Egyptians
80.0%
IN LABOR FORCE | AGE 20-64
95.5/ 100
METRIC RATING
101st/ 347
METRIC RANK
80.2%
IN LABOR FORCE | AGE 20-64
97.8/ 100
METRIC RATING
76th/ 347
METRIC RANK
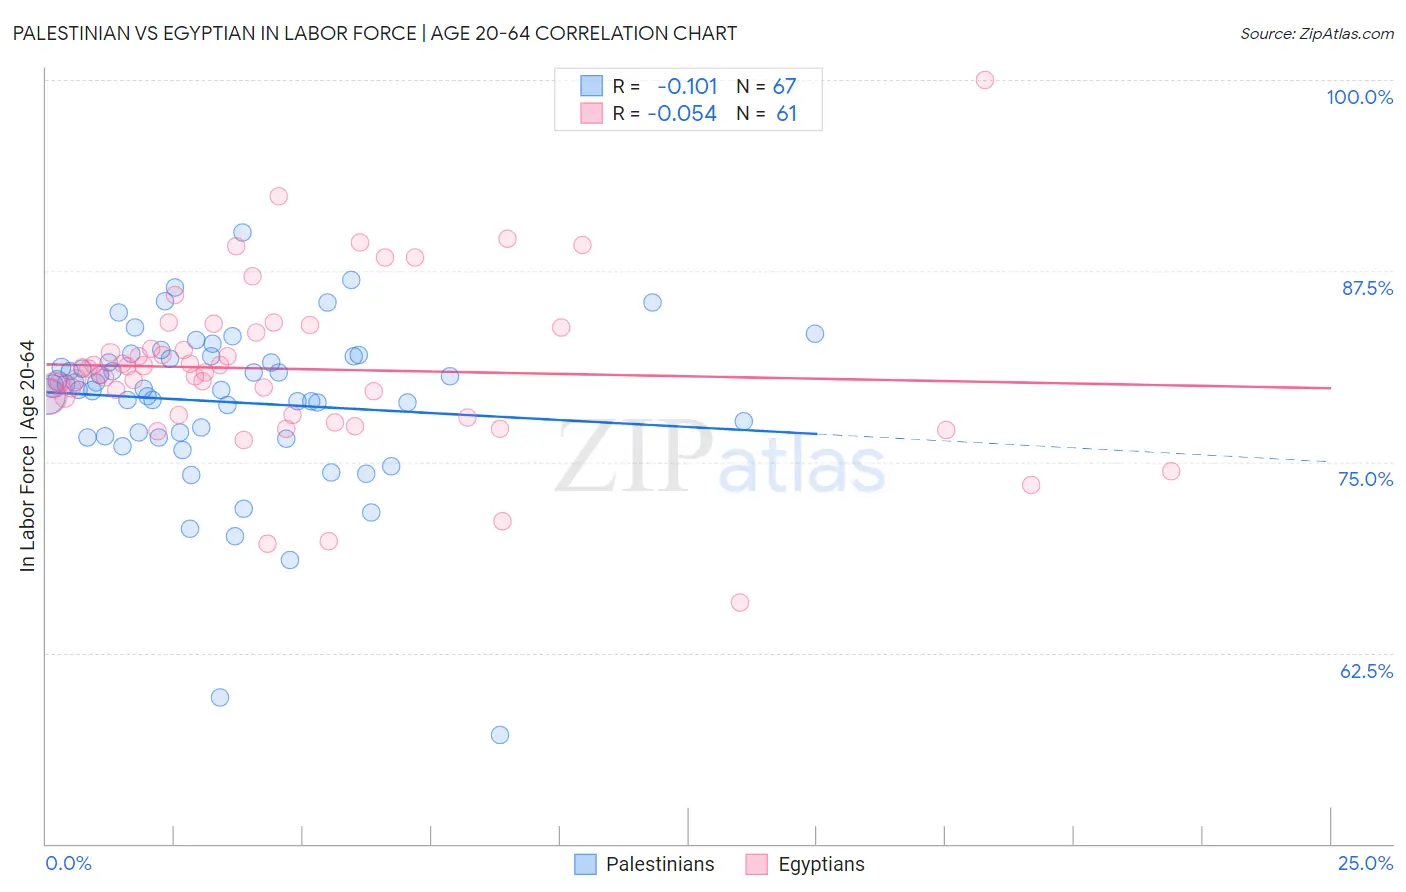
Palestinian vs Egyptian In Labor Force | Age 20-64 Correlation Chart
The statistical analysis conducted on geographies consisting of 216,468,318 people shows a poor negative correlation between the proportion of Palestinians and labor force participation rate among population between the ages 20 and 64 in the United States with a correlation coefficient (R) of -0.101 and weighted average of 80.0%. Similarly, the statistical analysis conducted on geographies consisting of 276,929,100 people shows a slight negative correlation between the proportion of Egyptians and labor force participation rate among population between the ages 20 and 64 in the United States with a correlation coefficient (R) of -0.054 and weighted average of 80.2%, a difference of 0.15%.
In Labor Force | Age 20-64 Correlation Summary
| Measurement | Palestinian | Egyptian |
| Minimum | 57.1% | 65.8% |
| Maximum | 90.0% | 100.0% |
| Range | 32.9% | 34.2% |
| Mean | 78.9% | 81.1% |
| Median | 79.8% | 80.9% |
| Interquartile 25% (IQ1) | 76.7% | 78.1% |
| Interquartile 75% (IQ3) | 81.9% | 83.6% |
| Interquartile Range (IQR) | 5.2% | 5.6% |
| Standard Deviation (Sample) | 5.4% | 5.5% |
| Standard Deviation (Population) | 5.4% | 5.5% |
Similar Demographics by In Labor Force | Age 20-64
Demographics Similar to Palestinians by In Labor Force | Age 20-64
In terms of in labor force | age 20-64, the demographic groups most similar to Palestinians are Filipino (80.1%, a difference of 0.0%), Immigrants from Australia (80.0%, a difference of 0.0%), Russian (80.0%, a difference of 0.0%), Immigrants from Chile (80.1%, a difference of 0.010%), and Venezuelan (80.0%, a difference of 0.010%).
| Demographics | Rating | Rank | In Labor Force | Age 20-64 |
| Immigrants | Asia | 96.0 /100 | #94 | Exceptional 80.1% |
| Yugoslavians | 95.9 /100 | #95 | Exceptional 80.1% |
| Immigrants | Malaysia | 95.9 /100 | #96 | Exceptional 80.1% |
| South Americans | 95.9 /100 | #97 | Exceptional 80.1% |
| Immigrants | Uruguay | 95.8 /100 | #98 | Exceptional 80.1% |
| Immigrants | Chile | 95.7 /100 | #99 | Exceptional 80.1% |
| Filipinos | 95.6 /100 | #100 | Exceptional 80.1% |
| Palestinians | 95.5 /100 | #101 | Exceptional 80.0% |
| Immigrants | Australia | 95.5 /100 | #102 | Exceptional 80.0% |
| Russians | 95.5 /100 | #103 | Exceptional 80.0% |
| Venezuelans | 95.3 /100 | #104 | Exceptional 80.0% |
| Immigrants | Ghana | 95.0 /100 | #105 | Exceptional 80.0% |
| Greeks | 94.8 /100 | #106 | Exceptional 80.0% |
| Immigrants | Jordan | 94.8 /100 | #107 | Exceptional 80.0% |
| Iranians | 94.3 /100 | #108 | Exceptional 80.0% |
Demographics Similar to Egyptians by In Labor Force | Age 20-64
In terms of in labor force | age 20-64, the demographic groups most similar to Egyptians are Immigrants from Colombia (80.2%, a difference of 0.0%), Immigrants from Romania (80.2%, a difference of 0.0%), Immigrants from Afghanistan (80.2%, a difference of 0.010%), Asian (80.2%, a difference of 0.010%), and Immigrants from Croatia (80.1%, a difference of 0.020%).
| Demographics | Rating | Rank | In Labor Force | Age 20-64 |
| Albanians | 98.6 /100 | #69 | Exceptional 80.2% |
| Immigrants | Turkey | 98.5 /100 | #70 | Exceptional 80.2% |
| Soviet Union | 98.5 /100 | #71 | Exceptional 80.2% |
| Eastern Europeans | 98.4 /100 | #72 | Exceptional 80.2% |
| Cypriots | 98.2 /100 | #73 | Exceptional 80.2% |
| Immigrants | Eastern Europe | 98.1 /100 | #74 | Exceptional 80.2% |
| Immigrants | Afghanistan | 97.9 /100 | #75 | Exceptional 80.2% |
| Egyptians | 97.8 /100 | #76 | Exceptional 80.2% |
| Immigrants | Colombia | 97.8 /100 | #77 | Exceptional 80.2% |
| Immigrants | Romania | 97.8 /100 | #78 | Exceptional 80.2% |
| Asians | 97.7 /100 | #79 | Exceptional 80.2% |
| Immigrants | Croatia | 97.6 /100 | #80 | Exceptional 80.1% |
| German Russians | 97.3 /100 | #81 | Exceptional 80.1% |
| Immigrants | Japan | 97.3 /100 | #82 | Exceptional 80.1% |
| Colombians | 97.3 /100 | #83 | Exceptional 80.1% |