Palestinian vs Immigrants from Israel In Labor Force | Age 20-64
COMPARE
Palestinian
Immigrants from Israel
In Labor Force | Age 20-64
In Labor Force | Age 20-64 Comparison
Palestinians
Immigrants from Israel
80.0%
IN LABOR FORCE | AGE 20-64
95.5/ 100
METRIC RATING
101st/ 347
METRIC RANK
79.8%
IN LABOR FORCE | AGE 20-64
80.0/ 100
METRIC RATING
141st/ 347
METRIC RANK
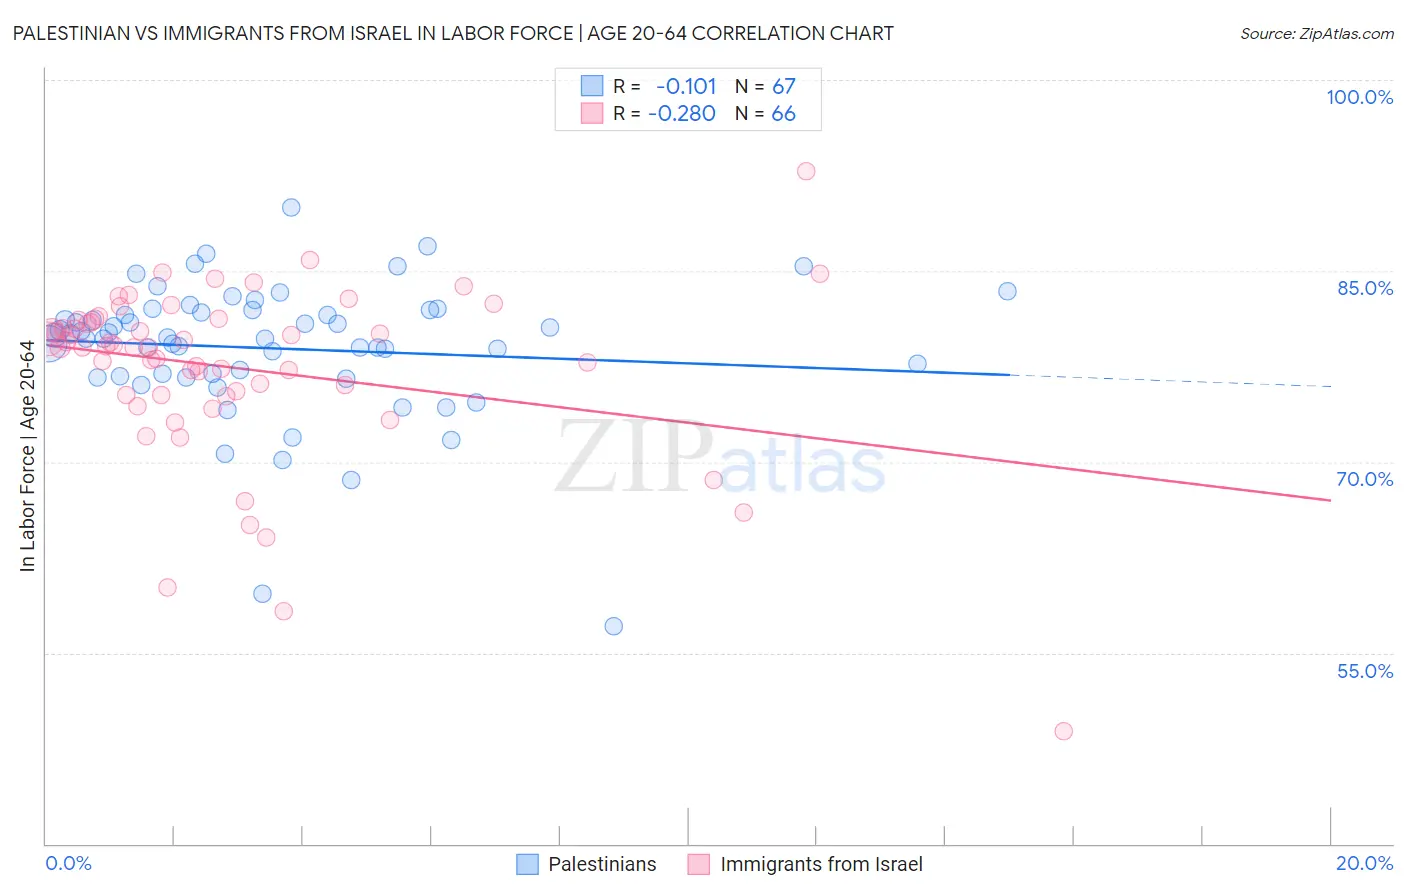
Palestinian vs Immigrants from Israel In Labor Force | Age 20-64 Correlation Chart
The statistical analysis conducted on geographies consisting of 216,468,318 people shows a poor negative correlation between the proportion of Palestinians and labor force participation rate among population between the ages 20 and 64 in the United States with a correlation coefficient (R) of -0.101 and weighted average of 80.0%. Similarly, the statistical analysis conducted on geographies consisting of 210,029,528 people shows a weak negative correlation between the proportion of Immigrants from Israel and labor force participation rate among population between the ages 20 and 64 in the United States with a correlation coefficient (R) of -0.280 and weighted average of 79.8%, a difference of 0.34%.
In Labor Force | Age 20-64 Correlation Summary
| Measurement | Palestinian | Immigrants from Israel |
| Minimum | 57.1% | 48.8% |
| Maximum | 90.0% | 92.8% |
| Range | 32.9% | 44.0% |
| Mean | 78.9% | 77.4% |
| Median | 79.8% | 79.1% |
| Interquartile 25% (IQ1) | 76.7% | 75.3% |
| Interquartile 75% (IQ3) | 81.9% | 81.2% |
| Interquartile Range (IQR) | 5.2% | 5.9% |
| Standard Deviation (Sample) | 5.4% | 7.0% |
| Standard Deviation (Population) | 5.4% | 6.9% |
Similar Demographics by In Labor Force | Age 20-64
Demographics Similar to Palestinians by In Labor Force | Age 20-64
In terms of in labor force | age 20-64, the demographic groups most similar to Palestinians are Filipino (80.1%, a difference of 0.0%), Immigrants from Australia (80.0%, a difference of 0.0%), Russian (80.0%, a difference of 0.0%), Immigrants from Chile (80.1%, a difference of 0.010%), and Venezuelan (80.0%, a difference of 0.010%).
| Demographics | Rating | Rank | In Labor Force | Age 20-64 |
| Immigrants | Asia | 96.0 /100 | #94 | Exceptional 80.1% |
| Yugoslavians | 95.9 /100 | #95 | Exceptional 80.1% |
| Immigrants | Malaysia | 95.9 /100 | #96 | Exceptional 80.1% |
| South Americans | 95.9 /100 | #97 | Exceptional 80.1% |
| Immigrants | Uruguay | 95.8 /100 | #98 | Exceptional 80.1% |
| Immigrants | Chile | 95.7 /100 | #99 | Exceptional 80.1% |
| Filipinos | 95.6 /100 | #100 | Exceptional 80.1% |
| Palestinians | 95.5 /100 | #101 | Exceptional 80.0% |
| Immigrants | Australia | 95.5 /100 | #102 | Exceptional 80.0% |
| Russians | 95.5 /100 | #103 | Exceptional 80.0% |
| Venezuelans | 95.3 /100 | #104 | Exceptional 80.0% |
| Immigrants | Ghana | 95.0 /100 | #105 | Exceptional 80.0% |
| Greeks | 94.8 /100 | #106 | Exceptional 80.0% |
| Immigrants | Jordan | 94.8 /100 | #107 | Exceptional 80.0% |
| Iranians | 94.3 /100 | #108 | Exceptional 80.0% |
Demographics Similar to Immigrants from Israel by In Labor Force | Age 20-64
In terms of in labor force | age 20-64, the demographic groups most similar to Immigrants from Israel are Immigrants from South Eastern Asia (79.8%, a difference of 0.0%), Slovak (79.8%, a difference of 0.0%), Immigrants from Sweden (79.8%, a difference of 0.0%), Korean (79.8%, a difference of 0.0%), and Pakistani (79.8%, a difference of 0.010%).
| Demographics | Rating | Rank | In Labor Force | Age 20-64 |
| Belgians | 87.4 /100 | #134 | Excellent 79.9% |
| Ukrainians | 86.8 /100 | #135 | Excellent 79.9% |
| Immigrants | Singapore | 86.7 /100 | #136 | Excellent 79.9% |
| Immigrants | Ukraine | 86.5 /100 | #137 | Excellent 79.9% |
| Immigrants | Nigeria | 86.4 /100 | #138 | Excellent 79.9% |
| Immigrants | Spain | 83.9 /100 | #139 | Excellent 79.8% |
| Immigrants | South Eastern Asia | 80.4 /100 | #140 | Excellent 79.8% |
| Immigrants | Israel | 80.0 /100 | #141 | Good 79.8% |
| Slovaks | 79.9 /100 | #142 | Good 79.8% |
| Immigrants | Sweden | 79.7 /100 | #143 | Good 79.8% |
| Koreans | 79.6 /100 | #144 | Good 79.8% |
| Pakistanis | 79.3 /100 | #145 | Good 79.8% |
| Immigrants | Southern Europe | 78.9 /100 | #146 | Good 79.8% |
| Immigrants | Philippines | 78.0 /100 | #147 | Good 79.8% |
| Romanians | 77.6 /100 | #148 | Good 79.8% |