Paiute vs U.S. Virgin Islander In Labor Force | Age 30-34
COMPARE
Paiute
U.S. Virgin Islander
In Labor Force | Age 30-34
In Labor Force | Age 30-34 Comparison
Paiute
U.S. Virgin Islanders
81.2%
IN LABOR FORCE | AGE 30-34
0.0/ 100
METRIC RATING
323rd/ 347
METRIC RANK
84.1%
IN LABOR FORCE | AGE 30-34
1.5/ 100
METRIC RATING
236th/ 347
METRIC RANK
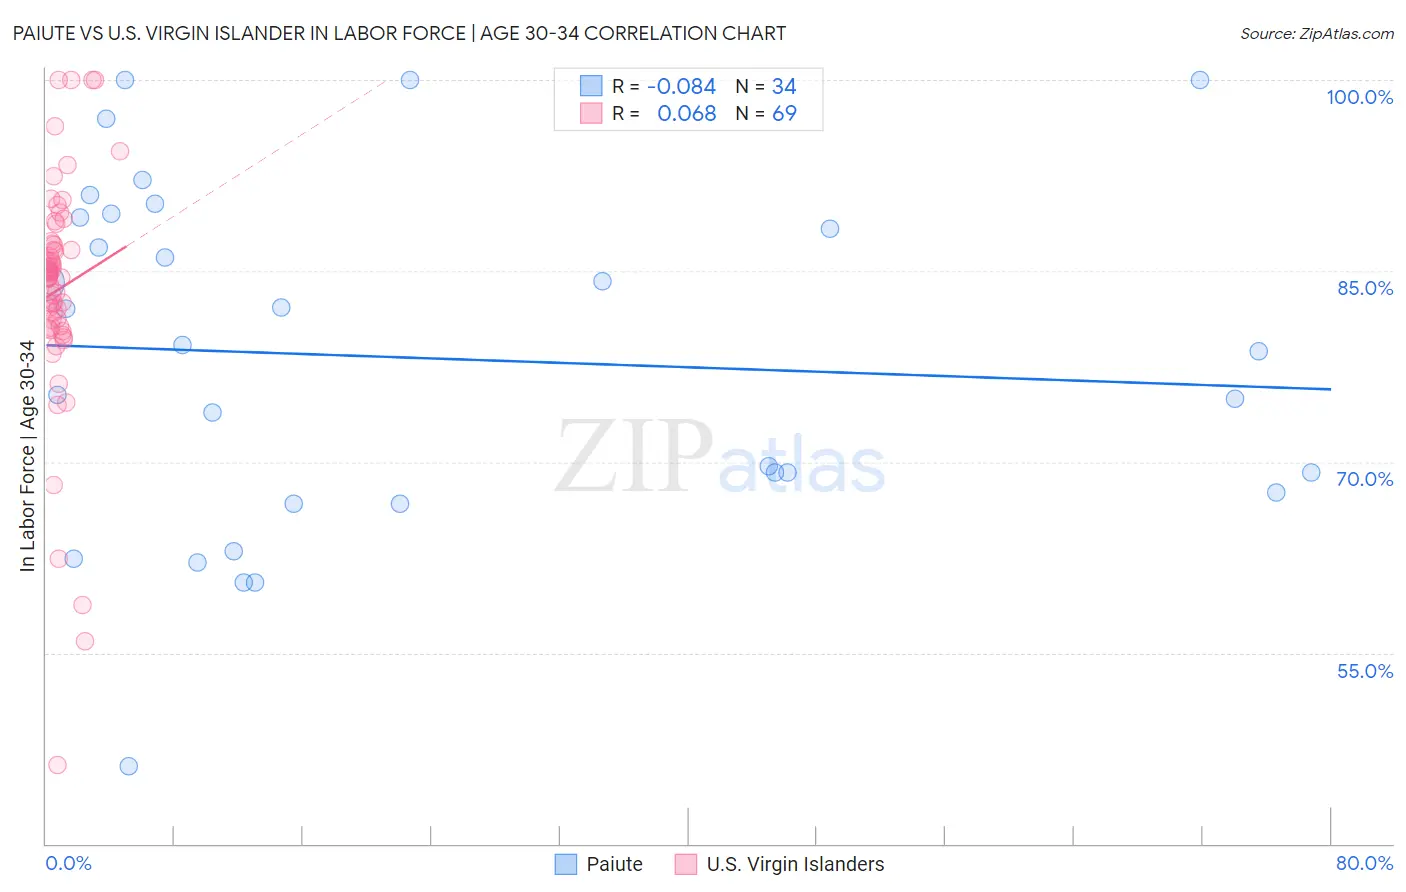
Paiute vs U.S. Virgin Islander In Labor Force | Age 30-34 Correlation Chart
The statistical analysis conducted on geographies consisting of 58,394,900 people shows a slight negative correlation between the proportion of Paiute and labor force participation rate among population between the ages 30 and 34 in the United States with a correlation coefficient (R) of -0.084 and weighted average of 81.2%. Similarly, the statistical analysis conducted on geographies consisting of 87,504,880 people shows a slight positive correlation between the proportion of U.S. Virgin Islanders and labor force participation rate among population between the ages 30 and 34 in the United States with a correlation coefficient (R) of 0.068 and weighted average of 84.1%, a difference of 3.6%.
In Labor Force | Age 30-34 Correlation Summary
| Measurement | Paiute | U.S. Virgin Islander |
| Minimum | 46.1% | 46.2% |
| Maximum | 100.0% | 100.0% |
| Range | 53.9% | 53.8% |
| Mean | 78.2% | 83.5% |
| Median | 78.9% | 84.6% |
| Interquartile 25% (IQ1) | 67.6% | 80.6% |
| Interquartile 75% (IQ3) | 89.2% | 87.1% |
| Interquartile Range (IQR) | 21.6% | 6.5% |
| Standard Deviation (Sample) | 13.5% | 9.2% |
| Standard Deviation (Population) | 13.3% | 9.1% |
Similar Demographics by In Labor Force | Age 30-34
Demographics Similar to Paiute by In Labor Force | Age 30-34
In terms of in labor force | age 30-34, the demographic groups most similar to Paiute are Cheyenne (81.1%, a difference of 0.030%), Puerto Rican (81.2%, a difference of 0.050%), Dutch West Indian (81.0%, a difference of 0.19%), Alaska Native (81.3%, a difference of 0.20%), and Yaqui (81.4%, a difference of 0.28%).
| Demographics | Rating | Rank | In Labor Force | Age 30-34 |
| Immigrants | Azores | 0.0 /100 | #316 | Tragic 81.5% |
| Arapaho | 0.0 /100 | #317 | Tragic 81.5% |
| Choctaw | 0.0 /100 | #318 | Tragic 81.4% |
| Shoshone | 0.0 /100 | #319 | Tragic 81.4% |
| Yaqui | 0.0 /100 | #320 | Tragic 81.4% |
| Alaska Natives | 0.0 /100 | #321 | Tragic 81.3% |
| Puerto Ricans | 0.0 /100 | #322 | Tragic 81.2% |
| Paiute | 0.0 /100 | #323 | Tragic 81.2% |
| Cheyenne | 0.0 /100 | #324 | Tragic 81.1% |
| Dutch West Indians | 0.0 /100 | #325 | Tragic 81.0% |
| Seminole | 0.0 /100 | #326 | Tragic 80.8% |
| Colville | 0.0 /100 | #327 | Tragic 80.7% |
| Sioux | 0.0 /100 | #328 | Tragic 80.4% |
| Creek | 0.0 /100 | #329 | Tragic 80.4% |
| Pueblo | 0.0 /100 | #330 | Tragic 80.0% |
Demographics Similar to U.S. Virgin Islanders by In Labor Force | Age 30-34
In terms of in labor force | age 30-34, the demographic groups most similar to U.S. Virgin Islanders are Celtic (84.1%, a difference of 0.010%), French American Indian (84.1%, a difference of 0.020%), Immigrants from Barbados (84.0%, a difference of 0.020%), English (84.0%, a difference of 0.020%), and Venezuelan (84.0%, a difference of 0.020%).
| Demographics | Rating | Rank | In Labor Force | Age 30-34 |
| Welsh | 2.7 /100 | #229 | Tragic 84.2% |
| Immigrants | Bahamas | 2.6 /100 | #230 | Tragic 84.1% |
| Malaysians | 2.2 /100 | #231 | Tragic 84.1% |
| Immigrants | Immigrants | 2.0 /100 | #232 | Tragic 84.1% |
| West Indians | 1.9 /100 | #233 | Tragic 84.1% |
| Haitians | 1.8 /100 | #234 | Tragic 84.1% |
| French American Indians | 1.7 /100 | #235 | Tragic 84.1% |
| U.S. Virgin Islanders | 1.5 /100 | #236 | Tragic 84.1% |
| Celtics | 1.4 /100 | #237 | Tragic 84.1% |
| Immigrants | Barbados | 1.4 /100 | #238 | Tragic 84.0% |
| English | 1.4 /100 | #239 | Tragic 84.0% |
| Venezuelans | 1.3 /100 | #240 | Tragic 84.0% |
| Immigrants | Portugal | 1.2 /100 | #241 | Tragic 84.0% |
| Immigrants | Oceania | 1.1 /100 | #242 | Tragic 84.0% |
| Immigrants | Caribbean | 1.1 /100 | #243 | Tragic 84.0% |