Iraqi vs U.S. Virgin Islander In Labor Force | Age 30-34
COMPARE
Iraqi
U.S. Virgin Islander
In Labor Force | Age 30-34
In Labor Force | Age 30-34 Comparison
Iraqis
U.S. Virgin Islanders
83.8%
IN LABOR FORCE | AGE 30-34
0.3/ 100
METRIC RATING
257th/ 347
METRIC RANK
84.1%
IN LABOR FORCE | AGE 30-34
1.5/ 100
METRIC RATING
236th/ 347
METRIC RANK
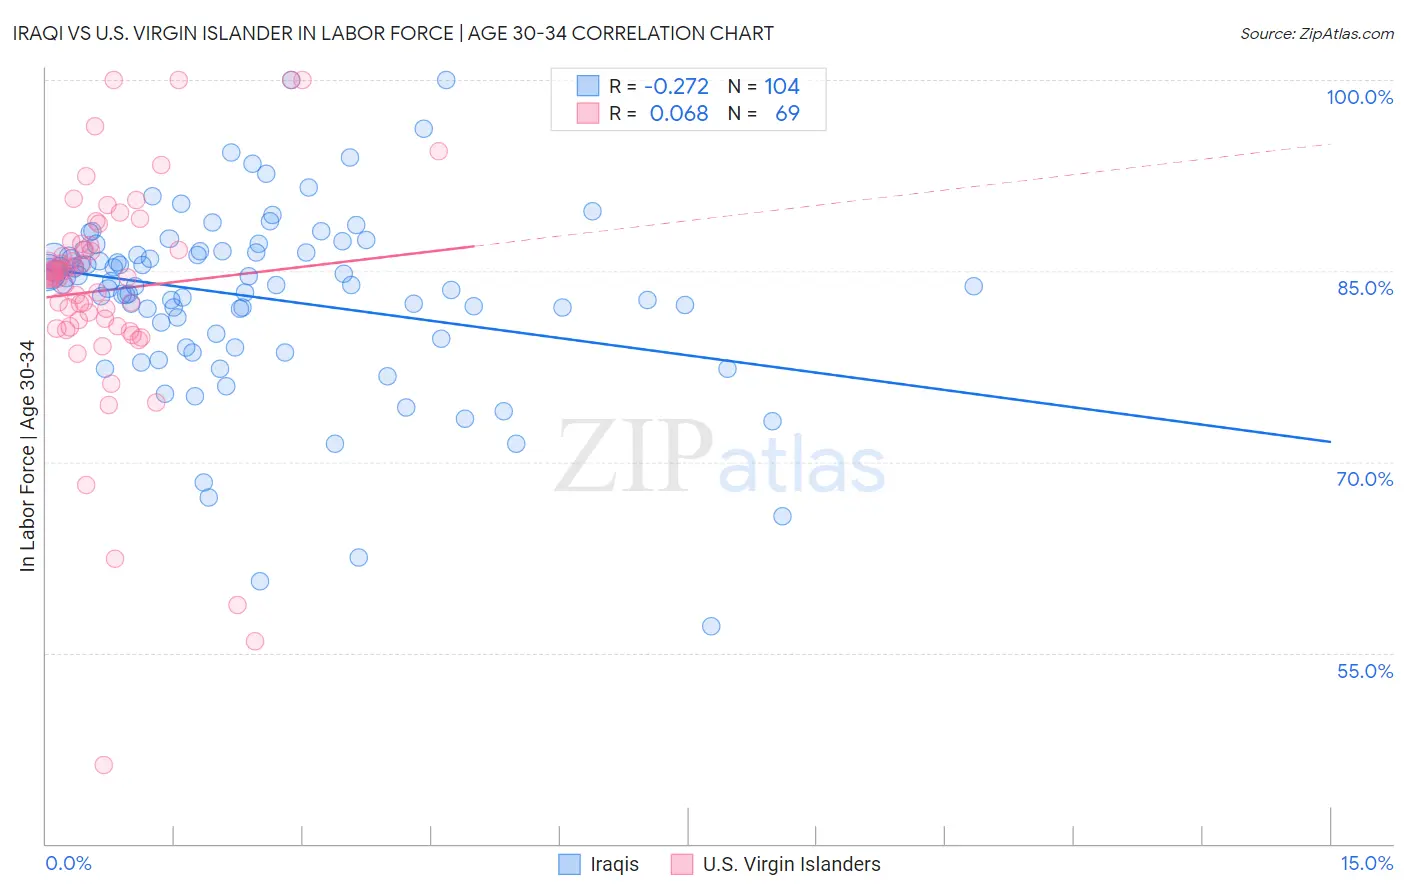
Iraqi vs U.S. Virgin Islander In Labor Force | Age 30-34 Correlation Chart
The statistical analysis conducted on geographies consisting of 170,642,929 people shows a weak negative correlation between the proportion of Iraqis and labor force participation rate among population between the ages 30 and 34 in the United States with a correlation coefficient (R) of -0.272 and weighted average of 83.8%. Similarly, the statistical analysis conducted on geographies consisting of 87,504,880 people shows a slight positive correlation between the proportion of U.S. Virgin Islanders and labor force participation rate among population between the ages 30 and 34 in the United States with a correlation coefficient (R) of 0.068 and weighted average of 84.1%, a difference of 0.26%.
In Labor Force | Age 30-34 Correlation Summary
| Measurement | Iraqi | U.S. Virgin Islander |
| Minimum | 57.1% | 46.2% |
| Maximum | 100.0% | 100.0% |
| Range | 42.9% | 53.8% |
| Mean | 82.9% | 83.5% |
| Median | 84.0% | 84.6% |
| Interquartile 25% (IQ1) | 79.8% | 80.6% |
| Interquartile 75% (IQ3) | 86.5% | 87.1% |
| Interquartile Range (IQR) | 6.7% | 6.5% |
| Standard Deviation (Sample) | 7.2% | 9.2% |
| Standard Deviation (Population) | 7.2% | 9.1% |
Similar Demographics by In Labor Force | Age 30-34
Demographics Similar to Iraqis by In Labor Force | Age 30-34
In terms of in labor force | age 30-34, the demographic groups most similar to Iraqis are Immigrants from Lebanon (83.9%, a difference of 0.010%), Honduran (83.8%, a difference of 0.030%), Scotch-Irish (83.8%, a difference of 0.030%), Immigrants from Dominican Republic (83.8%, a difference of 0.050%), and White/Caucasian (83.9%, a difference of 0.060%).
| Demographics | Rating | Rank | In Labor Force | Age 30-34 |
| Immigrants | Iraq | 0.7 /100 | #250 | Tragic 83.9% |
| Nicaraguans | 0.6 /100 | #251 | Tragic 83.9% |
| Bahamians | 0.6 /100 | #252 | Tragic 83.9% |
| Immigrants | Nicaragua | 0.6 /100 | #253 | Tragic 83.9% |
| Immigrants | St. Vincent and the Grenadines | 0.5 /100 | #254 | Tragic 83.9% |
| Whites/Caucasians | 0.5 /100 | #255 | Tragic 83.9% |
| Immigrants | Lebanon | 0.4 /100 | #256 | Tragic 83.9% |
| Iraqis | 0.3 /100 | #257 | Tragic 83.8% |
| Hondurans | 0.3 /100 | #258 | Tragic 83.8% |
| Scotch-Irish | 0.3 /100 | #259 | Tragic 83.8% |
| Immigrants | Dominican Republic | 0.3 /100 | #260 | Tragic 83.8% |
| Guyanese | 0.3 /100 | #261 | Tragic 83.8% |
| Dominicans | 0.2 /100 | #262 | Tragic 83.8% |
| Immigrants | Guyana | 0.2 /100 | #263 | Tragic 83.8% |
| Guatemalans | 0.2 /100 | #264 | Tragic 83.7% |
Demographics Similar to U.S. Virgin Islanders by In Labor Force | Age 30-34
In terms of in labor force | age 30-34, the demographic groups most similar to U.S. Virgin Islanders are Celtic (84.1%, a difference of 0.010%), French American Indian (84.1%, a difference of 0.020%), Immigrants from Barbados (84.0%, a difference of 0.020%), English (84.0%, a difference of 0.020%), and Venezuelan (84.0%, a difference of 0.020%).
| Demographics | Rating | Rank | In Labor Force | Age 30-34 |
| Welsh | 2.7 /100 | #229 | Tragic 84.2% |
| Immigrants | Bahamas | 2.6 /100 | #230 | Tragic 84.1% |
| Malaysians | 2.2 /100 | #231 | Tragic 84.1% |
| Immigrants | Immigrants | 2.0 /100 | #232 | Tragic 84.1% |
| West Indians | 1.9 /100 | #233 | Tragic 84.1% |
| Haitians | 1.8 /100 | #234 | Tragic 84.1% |
| French American Indians | 1.7 /100 | #235 | Tragic 84.1% |
| U.S. Virgin Islanders | 1.5 /100 | #236 | Tragic 84.1% |
| Celtics | 1.4 /100 | #237 | Tragic 84.1% |
| Immigrants | Barbados | 1.4 /100 | #238 | Tragic 84.0% |
| English | 1.4 /100 | #239 | Tragic 84.0% |
| Venezuelans | 1.3 /100 | #240 | Tragic 84.0% |
| Immigrants | Portugal | 1.2 /100 | #241 | Tragic 84.0% |
| Immigrants | Oceania | 1.1 /100 | #242 | Tragic 84.0% |
| Immigrants | Caribbean | 1.1 /100 | #243 | Tragic 84.0% |