Immigrants from Ghana vs U.S. Virgin Islander In Labor Force | Age 30-34
COMPARE
Immigrants from Ghana
U.S. Virgin Islander
In Labor Force | Age 30-34
In Labor Force | Age 30-34 Comparison
Immigrants from Ghana
U.S. Virgin Islanders
85.2%
IN LABOR FORCE | AGE 30-34
96.5/ 100
METRIC RATING
104th/ 347
METRIC RANK
84.1%
IN LABOR FORCE | AGE 30-34
1.5/ 100
METRIC RATING
236th/ 347
METRIC RANK
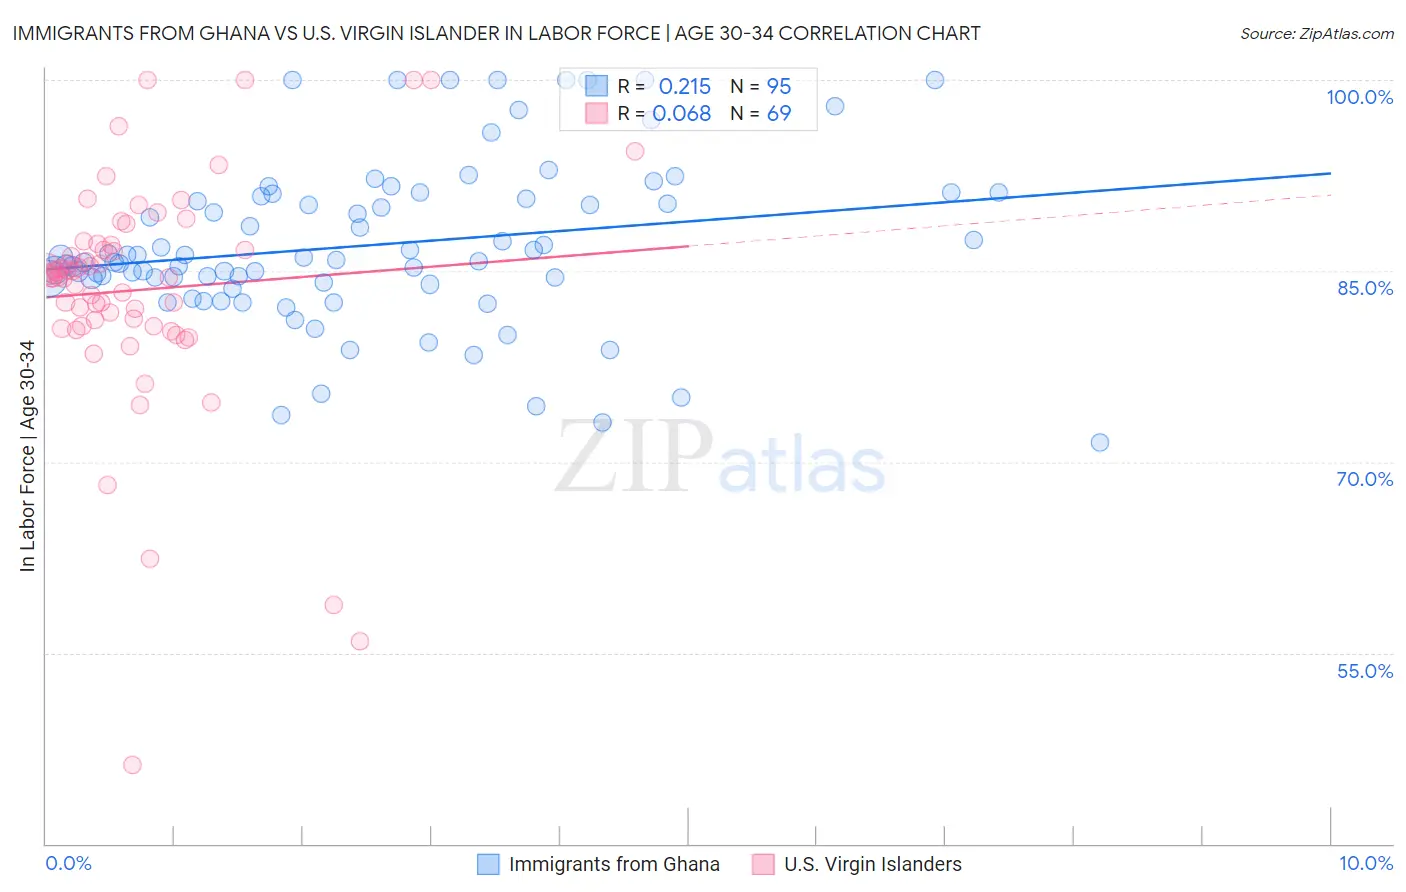
Immigrants from Ghana vs U.S. Virgin Islander In Labor Force | Age 30-34 Correlation Chart
The statistical analysis conducted on geographies consisting of 199,865,631 people shows a weak positive correlation between the proportion of Immigrants from Ghana and labor force participation rate among population between the ages 30 and 34 in the United States with a correlation coefficient (R) of 0.215 and weighted average of 85.2%. Similarly, the statistical analysis conducted on geographies consisting of 87,504,880 people shows a slight positive correlation between the proportion of U.S. Virgin Islanders and labor force participation rate among population between the ages 30 and 34 in the United States with a correlation coefficient (R) of 0.068 and weighted average of 84.1%, a difference of 1.3%.
In Labor Force | Age 30-34 Correlation Summary
| Measurement | Immigrants from Ghana | U.S. Virgin Islander |
| Minimum | 71.5% | 46.2% |
| Maximum | 100.0% | 100.0% |
| Range | 28.5% | 53.8% |
| Mean | 87.0% | 83.5% |
| Median | 85.8% | 84.6% |
| Interquartile 25% (IQ1) | 84.1% | 80.6% |
| Interquartile 75% (IQ3) | 90.9% | 87.1% |
| Interquartile Range (IQR) | 6.8% | 6.5% |
| Standard Deviation (Sample) | 6.4% | 9.2% |
| Standard Deviation (Population) | 6.4% | 9.1% |
Similar Demographics by In Labor Force | Age 30-34
Demographics Similar to Immigrants from Ghana by In Labor Force | Age 30-34
In terms of in labor force | age 30-34, the demographic groups most similar to Immigrants from Ghana are Ukrainian (85.2%, a difference of 0.0%), Immigrants from Austria (85.2%, a difference of 0.010%), Alsatian (85.2%, a difference of 0.010%), Immigrants from Middle Africa (85.2%, a difference of 0.010%), and Immigrants from Northern Africa (85.2%, a difference of 0.010%).
| Demographics | Rating | Rank | In Labor Force | Age 30-34 |
| Thais | 97.2 /100 | #97 | Exceptional 85.2% |
| Immigrants | Uganda | 97.2 /100 | #98 | Exceptional 85.2% |
| Belgians | 97.2 /100 | #99 | Exceptional 85.2% |
| Sudanese | 97.1 /100 | #100 | Exceptional 85.2% |
| Immigrants | Belarus | 96.9 /100 | #101 | Exceptional 85.2% |
| Immigrants | Austria | 96.8 /100 | #102 | Exceptional 85.2% |
| Ukrainians | 96.6 /100 | #103 | Exceptional 85.2% |
| Immigrants | Ghana | 96.5 /100 | #104 | Exceptional 85.2% |
| Alsatians | 96.3 /100 | #105 | Exceptional 85.2% |
| Immigrants | Middle Africa | 96.3 /100 | #106 | Exceptional 85.2% |
| Immigrants | Northern Africa | 96.3 /100 | #107 | Exceptional 85.2% |
| Immigrants | Zimbabwe | 95.8 /100 | #108 | Exceptional 85.1% |
| Argentineans | 95.8 /100 | #109 | Exceptional 85.1% |
| Immigrants | South Africa | 95.3 /100 | #110 | Exceptional 85.1% |
| Immigrants | Scotland | 94.9 /100 | #111 | Exceptional 85.1% |
Demographics Similar to U.S. Virgin Islanders by In Labor Force | Age 30-34
In terms of in labor force | age 30-34, the demographic groups most similar to U.S. Virgin Islanders are Celtic (84.1%, a difference of 0.010%), French American Indian (84.1%, a difference of 0.020%), Immigrants from Barbados (84.0%, a difference of 0.020%), English (84.0%, a difference of 0.020%), and Venezuelan (84.0%, a difference of 0.020%).
| Demographics | Rating | Rank | In Labor Force | Age 30-34 |
| Welsh | 2.7 /100 | #229 | Tragic 84.2% |
| Immigrants | Bahamas | 2.6 /100 | #230 | Tragic 84.1% |
| Malaysians | 2.2 /100 | #231 | Tragic 84.1% |
| Immigrants | Immigrants | 2.0 /100 | #232 | Tragic 84.1% |
| West Indians | 1.9 /100 | #233 | Tragic 84.1% |
| Haitians | 1.8 /100 | #234 | Tragic 84.1% |
| French American Indians | 1.7 /100 | #235 | Tragic 84.1% |
| U.S. Virgin Islanders | 1.5 /100 | #236 | Tragic 84.1% |
| Celtics | 1.4 /100 | #237 | Tragic 84.1% |
| Immigrants | Barbados | 1.4 /100 | #238 | Tragic 84.0% |
| English | 1.4 /100 | #239 | Tragic 84.0% |
| Venezuelans | 1.3 /100 | #240 | Tragic 84.0% |
| Immigrants | Portugal | 1.2 /100 | #241 | Tragic 84.0% |
| Immigrants | Oceania | 1.1 /100 | #242 | Tragic 84.0% |
| Immigrants | Caribbean | 1.1 /100 | #243 | Tragic 84.0% |