Paiute vs Estonian In Labor Force | Age 30-34
COMPARE
Paiute
Estonian
In Labor Force | Age 30-34
In Labor Force | Age 30-34 Comparison
Paiute
Estonians
81.2%
IN LABOR FORCE | AGE 30-34
0.0/ 100
METRIC RATING
323rd/ 347
METRIC RANK
85.9%
IN LABOR FORCE | AGE 30-34
100.0/ 100
METRIC RATING
23rd/ 347
METRIC RANK
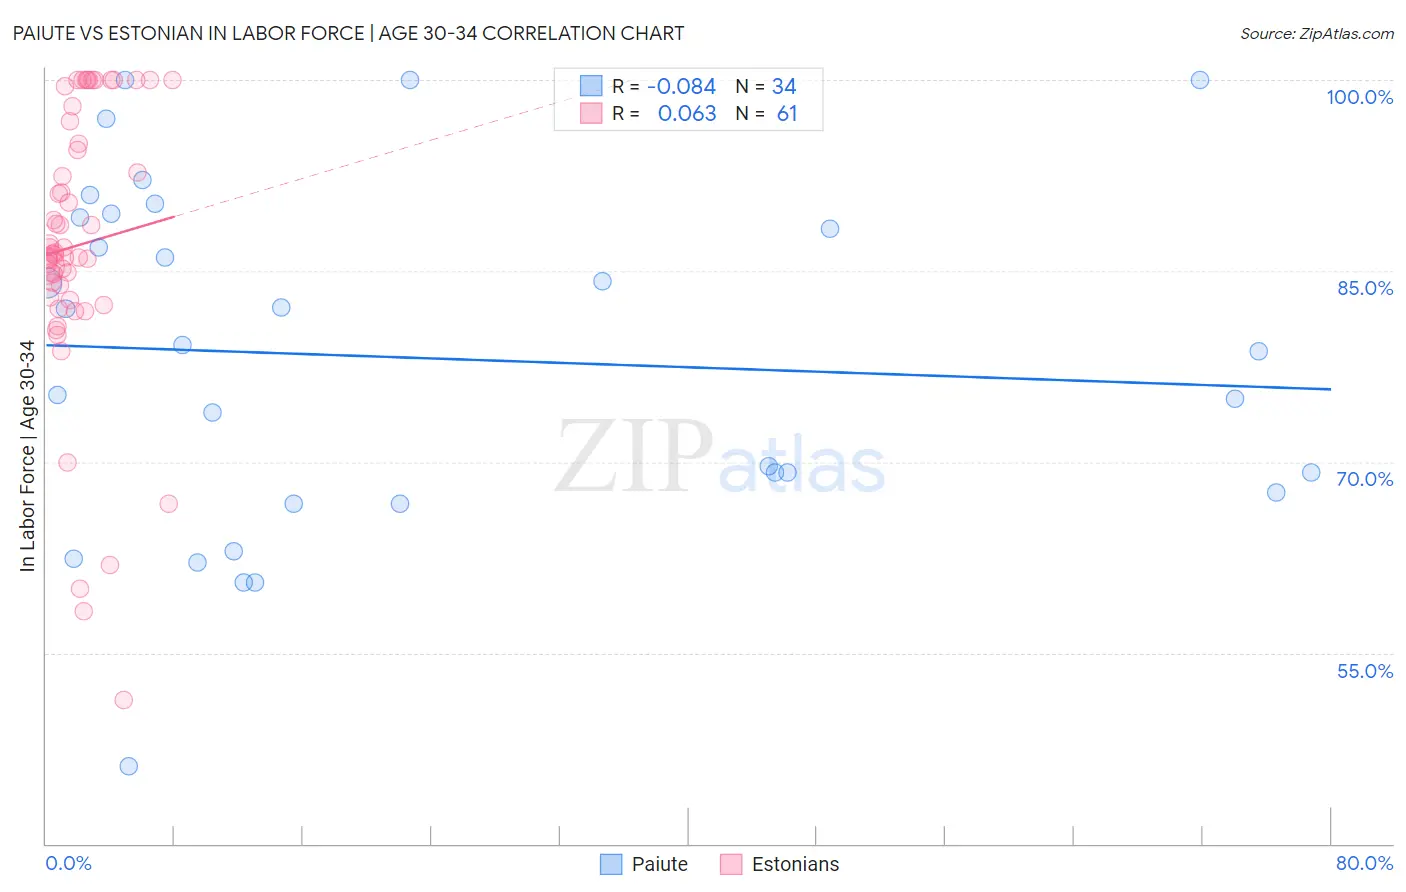
Paiute vs Estonian In Labor Force | Age 30-34 Correlation Chart
The statistical analysis conducted on geographies consisting of 58,394,900 people shows a slight negative correlation between the proportion of Paiute and labor force participation rate among population between the ages 30 and 34 in the United States with a correlation coefficient (R) of -0.084 and weighted average of 81.2%. Similarly, the statistical analysis conducted on geographies consisting of 123,489,392 people shows a slight positive correlation between the proportion of Estonians and labor force participation rate among population between the ages 30 and 34 in the United States with a correlation coefficient (R) of 0.063 and weighted average of 85.9%, a difference of 5.9%.
In Labor Force | Age 30-34 Correlation Summary
| Measurement | Paiute | Estonian |
| Minimum | 46.1% | 51.3% |
| Maximum | 100.0% | 100.0% |
| Range | 53.9% | 48.7% |
| Mean | 78.2% | 87.0% |
| Median | 78.9% | 86.3% |
| Interquartile 25% (IQ1) | 67.6% | 82.8% |
| Interquartile 75% (IQ3) | 89.2% | 95.9% |
| Interquartile Range (IQR) | 21.6% | 13.1% |
| Standard Deviation (Sample) | 13.5% | 10.9% |
| Standard Deviation (Population) | 13.3% | 10.9% |
Similar Demographics by In Labor Force | Age 30-34
Demographics Similar to Paiute by In Labor Force | Age 30-34
In terms of in labor force | age 30-34, the demographic groups most similar to Paiute are Cheyenne (81.1%, a difference of 0.030%), Puerto Rican (81.2%, a difference of 0.050%), Dutch West Indian (81.0%, a difference of 0.19%), Alaska Native (81.3%, a difference of 0.20%), and Yaqui (81.4%, a difference of 0.28%).
| Demographics | Rating | Rank | In Labor Force | Age 30-34 |
| Immigrants | Azores | 0.0 /100 | #316 | Tragic 81.5% |
| Arapaho | 0.0 /100 | #317 | Tragic 81.5% |
| Choctaw | 0.0 /100 | #318 | Tragic 81.4% |
| Shoshone | 0.0 /100 | #319 | Tragic 81.4% |
| Yaqui | 0.0 /100 | #320 | Tragic 81.4% |
| Alaska Natives | 0.0 /100 | #321 | Tragic 81.3% |
| Puerto Ricans | 0.0 /100 | #322 | Tragic 81.2% |
| Paiute | 0.0 /100 | #323 | Tragic 81.2% |
| Cheyenne | 0.0 /100 | #324 | Tragic 81.1% |
| Dutch West Indians | 0.0 /100 | #325 | Tragic 81.0% |
| Seminole | 0.0 /100 | #326 | Tragic 80.8% |
| Colville | 0.0 /100 | #327 | Tragic 80.7% |
| Sioux | 0.0 /100 | #328 | Tragic 80.4% |
| Creek | 0.0 /100 | #329 | Tragic 80.4% |
| Pueblo | 0.0 /100 | #330 | Tragic 80.0% |
Demographics Similar to Estonians by In Labor Force | Age 30-34
In terms of in labor force | age 30-34, the demographic groups most similar to Estonians are Bermudan (85.9%, a difference of 0.0%), Immigrants from Eritrea (85.9%, a difference of 0.010%), Immigrants from North Macedonia (85.9%, a difference of 0.020%), Sierra Leonean (86.0%, a difference of 0.030%), and Bulgarian (86.0%, a difference of 0.030%).
| Demographics | Rating | Rank | In Labor Force | Age 30-34 |
| Latvians | 100.0 /100 | #16 | Exceptional 86.0% |
| Immigrants | Cameroon | 100.0 /100 | #17 | Exceptional 86.0% |
| Immigrants | Sierra Leone | 100.0 /100 | #18 | Exceptional 86.0% |
| Sierra Leoneans | 100.0 /100 | #19 | Exceptional 86.0% |
| Bulgarians | 100.0 /100 | #20 | Exceptional 86.0% |
| Immigrants | Bulgaria | 100.0 /100 | #21 | Exceptional 86.0% |
| Bermudans | 100.0 /100 | #22 | Exceptional 85.9% |
| Estonians | 100.0 /100 | #23 | Exceptional 85.9% |
| Immigrants | Eritrea | 100.0 /100 | #24 | Exceptional 85.9% |
| Immigrants | North Macedonia | 100.0 /100 | #25 | Exceptional 85.9% |
| Immigrants | Eastern Africa | 100.0 /100 | #26 | Exceptional 85.9% |
| Immigrants | Liberia | 100.0 /100 | #27 | Exceptional 85.9% |
| Immigrants | Latvia | 100.0 /100 | #28 | Exceptional 85.9% |
| Tsimshian | 100.0 /100 | #29 | Exceptional 85.8% |
| Immigrants | Hong Kong | 100.0 /100 | #30 | Exceptional 85.8% |