Paiute vs Spanish American Indian In Labor Force | Age 30-34
COMPARE
Paiute
Spanish American Indian
In Labor Force | Age 30-34
In Labor Force | Age 30-34 Comparison
Paiute
Spanish American Indians
81.2%
IN LABOR FORCE | AGE 30-34
0.0/ 100
METRIC RATING
323rd/ 347
METRIC RANK
82.2%
IN LABOR FORCE | AGE 30-34
0.0/ 100
METRIC RATING
306th/ 347
METRIC RANK
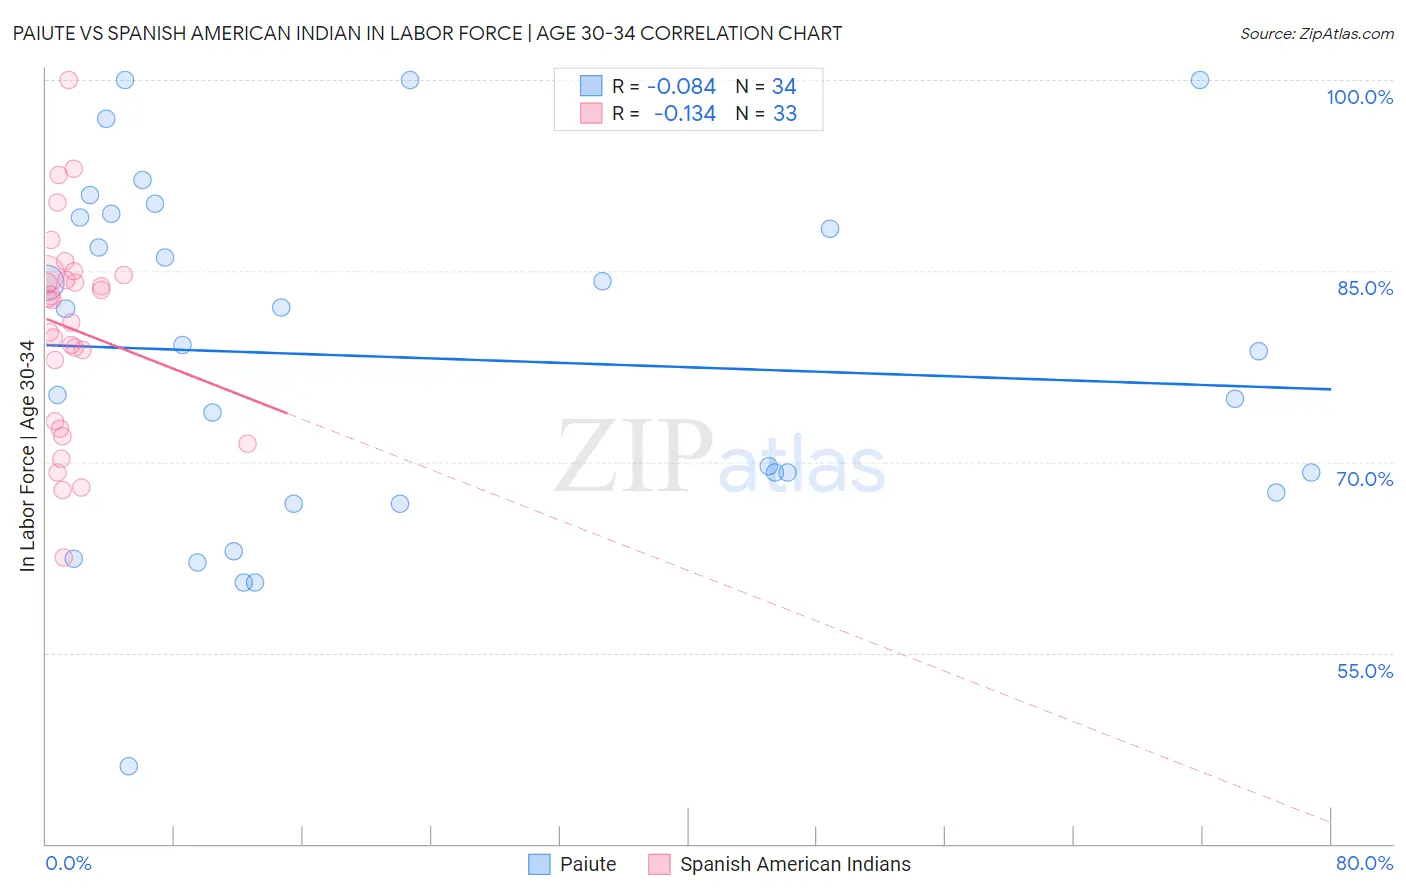
Paiute vs Spanish American Indian In Labor Force | Age 30-34 Correlation Chart
The statistical analysis conducted on geographies consisting of 58,394,900 people shows a slight negative correlation between the proportion of Paiute and labor force participation rate among population between the ages 30 and 34 in the United States with a correlation coefficient (R) of -0.084 and weighted average of 81.2%. Similarly, the statistical analysis conducted on geographies consisting of 73,143,420 people shows a poor negative correlation between the proportion of Spanish American Indians and labor force participation rate among population between the ages 30 and 34 in the United States with a correlation coefficient (R) of -0.134 and weighted average of 82.2%, a difference of 1.3%.
In Labor Force | Age 30-34 Correlation Summary
| Measurement | Paiute | Spanish American Indian |
| Minimum | 46.1% | 62.5% |
| Maximum | 100.0% | 100.0% |
| Range | 53.9% | 37.5% |
| Mean | 78.2% | 80.5% |
| Median | 78.9% | 82.7% |
| Interquartile 25% (IQ1) | 67.6% | 72.9% |
| Interquartile 75% (IQ3) | 89.2% | 84.7% |
| Interquartile Range (IQR) | 21.6% | 11.8% |
| Standard Deviation (Sample) | 13.5% | 8.2% |
| Standard Deviation (Population) | 13.3% | 8.1% |
Demographics Similar to Paiute and Spanish American Indians by In Labor Force | Age 30-34
In terms of in labor force | age 30-34, the demographic groups most similar to Paiute are Cheyenne (81.1%, a difference of 0.030%), Puerto Rican (81.2%, a difference of 0.050%), Alaska Native (81.3%, a difference of 0.20%), Yaqui (81.4%, a difference of 0.28%), and Choctaw (81.4%, a difference of 0.30%). Similarly, the demographic groups most similar to Spanish American Indians are Osage (82.3%, a difference of 0.020%), Menominee (82.2%, a difference of 0.060%), Tlingit-Haida (82.3%, a difference of 0.090%), Puget Sound Salish (82.1%, a difference of 0.16%), and Immigrants from Mexico (82.0%, a difference of 0.32%).
| Demographics | Rating | Rank | In Labor Force | Age 30-34 |
| Tlingit-Haida | 0.0 /100 | #304 | Tragic 82.3% |
| Osage | 0.0 /100 | #305 | Tragic 82.3% |
| Spanish American Indians | 0.0 /100 | #306 | Tragic 82.2% |
| Menominee | 0.0 /100 | #307 | Tragic 82.2% |
| Puget Sound Salish | 0.0 /100 | #308 | Tragic 82.1% |
| Immigrants | Mexico | 0.0 /100 | #309 | Tragic 82.0% |
| Cajuns | 0.0 /100 | #310 | Tragic 82.0% |
| Chickasaw | 0.0 /100 | #311 | Tragic 81.9% |
| Mexicans | 0.0 /100 | #312 | Tragic 81.9% |
| Iroquois | 0.0 /100 | #313 | Tragic 81.9% |
| Alaskan Athabascans | 0.0 /100 | #314 | Tragic 81.7% |
| Cherokee | 0.0 /100 | #315 | Tragic 81.6% |
| Immigrants | Azores | 0.0 /100 | #316 | Tragic 81.5% |
| Arapaho | 0.0 /100 | #317 | Tragic 81.5% |
| Choctaw | 0.0 /100 | #318 | Tragic 81.4% |
| Shoshone | 0.0 /100 | #319 | Tragic 81.4% |
| Yaqui | 0.0 /100 | #320 | Tragic 81.4% |
| Alaska Natives | 0.0 /100 | #321 | Tragic 81.3% |
| Puerto Ricans | 0.0 /100 | #322 | Tragic 81.2% |
| Paiute | 0.0 /100 | #323 | Tragic 81.2% |
| Cheyenne | 0.0 /100 | #324 | Tragic 81.1% |