Paiute vs Argentinean In Labor Force | Age 30-34
COMPARE
Paiute
Argentinean
In Labor Force | Age 30-34
In Labor Force | Age 30-34 Comparison
Paiute
Argentineans
81.2%
IN LABOR FORCE | AGE 30-34
0.0/ 100
METRIC RATING
323rd/ 347
METRIC RANK
85.1%
IN LABOR FORCE | AGE 30-34
95.8/ 100
METRIC RATING
109th/ 347
METRIC RANK
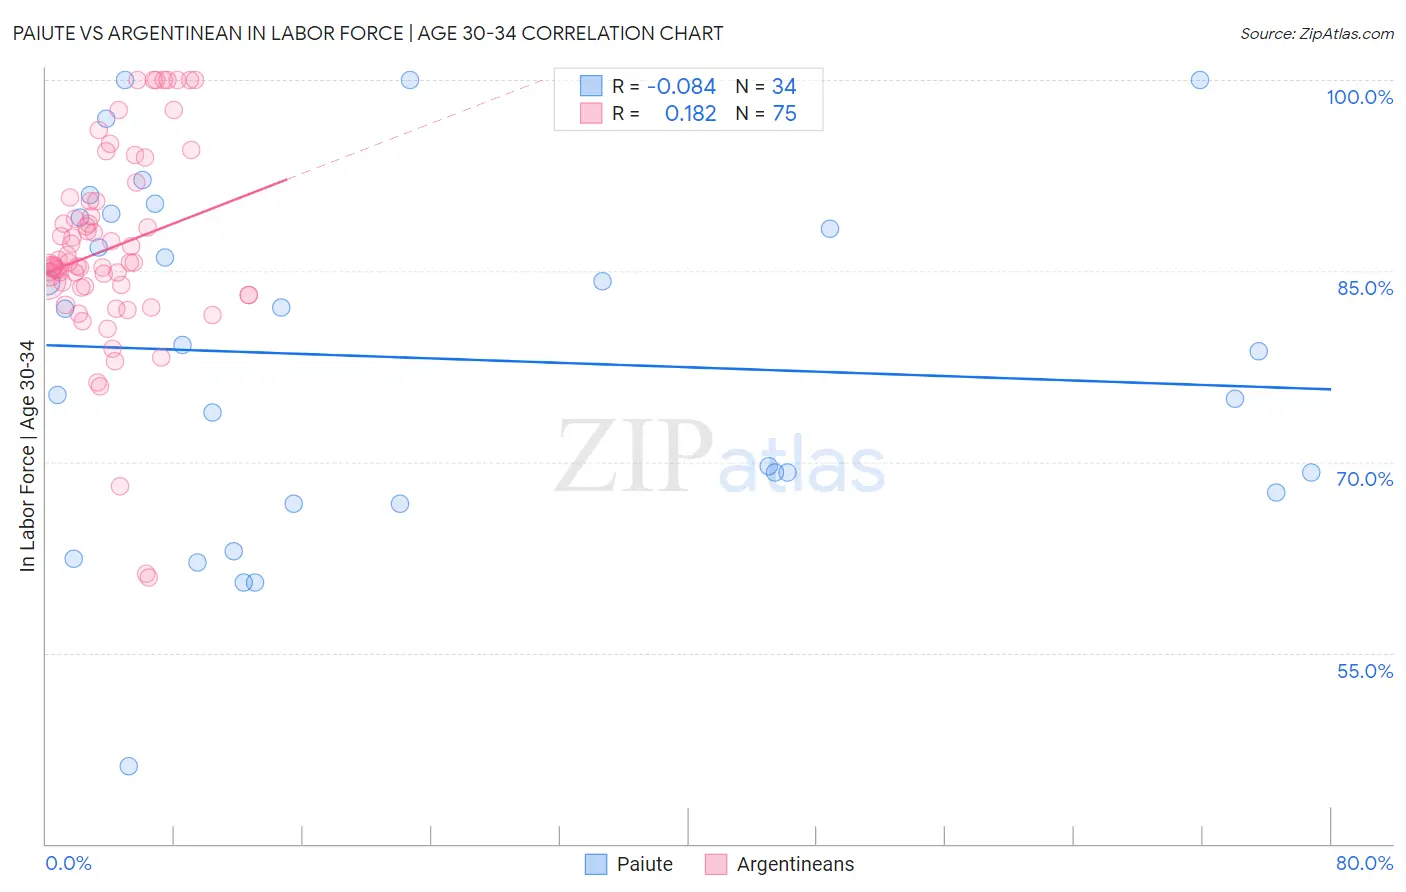
Paiute vs Argentinean In Labor Force | Age 30-34 Correlation Chart
The statistical analysis conducted on geographies consisting of 58,394,900 people shows a slight negative correlation between the proportion of Paiute and labor force participation rate among population between the ages 30 and 34 in the United States with a correlation coefficient (R) of -0.084 and weighted average of 81.2%. Similarly, the statistical analysis conducted on geographies consisting of 297,011,031 people shows a poor positive correlation between the proportion of Argentineans and labor force participation rate among population between the ages 30 and 34 in the United States with a correlation coefficient (R) of 0.182 and weighted average of 85.1%, a difference of 4.9%.
In Labor Force | Age 30-34 Correlation Summary
| Measurement | Paiute | Argentinean |
| Minimum | 46.1% | 60.9% |
| Maximum | 100.0% | 100.0% |
| Range | 53.9% | 39.1% |
| Mean | 78.2% | 86.8% |
| Median | 78.9% | 85.7% |
| Interquartile 25% (IQ1) | 67.6% | 83.7% |
| Interquartile 75% (IQ3) | 89.2% | 90.4% |
| Interquartile Range (IQR) | 21.6% | 6.7% |
| Standard Deviation (Sample) | 13.5% | 7.8% |
| Standard Deviation (Population) | 13.3% | 7.8% |
Similar Demographics by In Labor Force | Age 30-34
Demographics Similar to Paiute by In Labor Force | Age 30-34
In terms of in labor force | age 30-34, the demographic groups most similar to Paiute are Cheyenne (81.1%, a difference of 0.030%), Puerto Rican (81.2%, a difference of 0.050%), Dutch West Indian (81.0%, a difference of 0.19%), Alaska Native (81.3%, a difference of 0.20%), and Yaqui (81.4%, a difference of 0.28%).
| Demographics | Rating | Rank | In Labor Force | Age 30-34 |
| Immigrants | Azores | 0.0 /100 | #316 | Tragic 81.5% |
| Arapaho | 0.0 /100 | #317 | Tragic 81.5% |
| Choctaw | 0.0 /100 | #318 | Tragic 81.4% |
| Shoshone | 0.0 /100 | #319 | Tragic 81.4% |
| Yaqui | 0.0 /100 | #320 | Tragic 81.4% |
| Alaska Natives | 0.0 /100 | #321 | Tragic 81.3% |
| Puerto Ricans | 0.0 /100 | #322 | Tragic 81.2% |
| Paiute | 0.0 /100 | #323 | Tragic 81.2% |
| Cheyenne | 0.0 /100 | #324 | Tragic 81.1% |
| Dutch West Indians | 0.0 /100 | #325 | Tragic 81.0% |
| Seminole | 0.0 /100 | #326 | Tragic 80.8% |
| Colville | 0.0 /100 | #327 | Tragic 80.7% |
| Sioux | 0.0 /100 | #328 | Tragic 80.4% |
| Creek | 0.0 /100 | #329 | Tragic 80.4% |
| Pueblo | 0.0 /100 | #330 | Tragic 80.0% |
Demographics Similar to Argentineans by In Labor Force | Age 30-34
In terms of in labor force | age 30-34, the demographic groups most similar to Argentineans are Immigrants from Zimbabwe (85.1%, a difference of 0.0%), Immigrants from Northern Africa (85.2%, a difference of 0.020%), Immigrants from South Africa (85.1%, a difference of 0.020%), Alsatian (85.2%, a difference of 0.030%), and Immigrants from Middle Africa (85.2%, a difference of 0.030%).
| Demographics | Rating | Rank | In Labor Force | Age 30-34 |
| Immigrants | Austria | 96.8 /100 | #102 | Exceptional 85.2% |
| Ukrainians | 96.6 /100 | #103 | Exceptional 85.2% |
| Immigrants | Ghana | 96.5 /100 | #104 | Exceptional 85.2% |
| Alsatians | 96.3 /100 | #105 | Exceptional 85.2% |
| Immigrants | Middle Africa | 96.3 /100 | #106 | Exceptional 85.2% |
| Immigrants | Northern Africa | 96.3 /100 | #107 | Exceptional 85.2% |
| Immigrants | Zimbabwe | 95.8 /100 | #108 | Exceptional 85.1% |
| Argentineans | 95.8 /100 | #109 | Exceptional 85.1% |
| Immigrants | South Africa | 95.3 /100 | #110 | Exceptional 85.1% |
| Immigrants | Scotland | 94.9 /100 | #111 | Exceptional 85.1% |
| Immigrants | Hungary | 94.8 /100 | #112 | Exceptional 85.1% |
| Immigrants | Romania | 94.7 /100 | #113 | Exceptional 85.1% |
| Yugoslavians | 94.7 /100 | #114 | Exceptional 85.1% |
| Immigrants | South Central Asia | 94.6 /100 | #115 | Exceptional 85.1% |
| Egyptians | 94.5 /100 | #116 | Exceptional 85.1% |