Paiute vs Sierra Leonean In Labor Force | Age > 16
COMPARE
Paiute
Sierra Leonean
In Labor Force | Age > 16
In Labor Force | Age > 16 Comparison
Paiute
Sierra Leoneans
60.7%
IN LABOR FORCE | AGE > 16
0.0/ 100
METRIC RATING
333rd/ 347
METRIC RANK
68.9%
IN LABOR FORCE | AGE > 16
100.0/ 100
METRIC RATING
5th/ 347
METRIC RANK
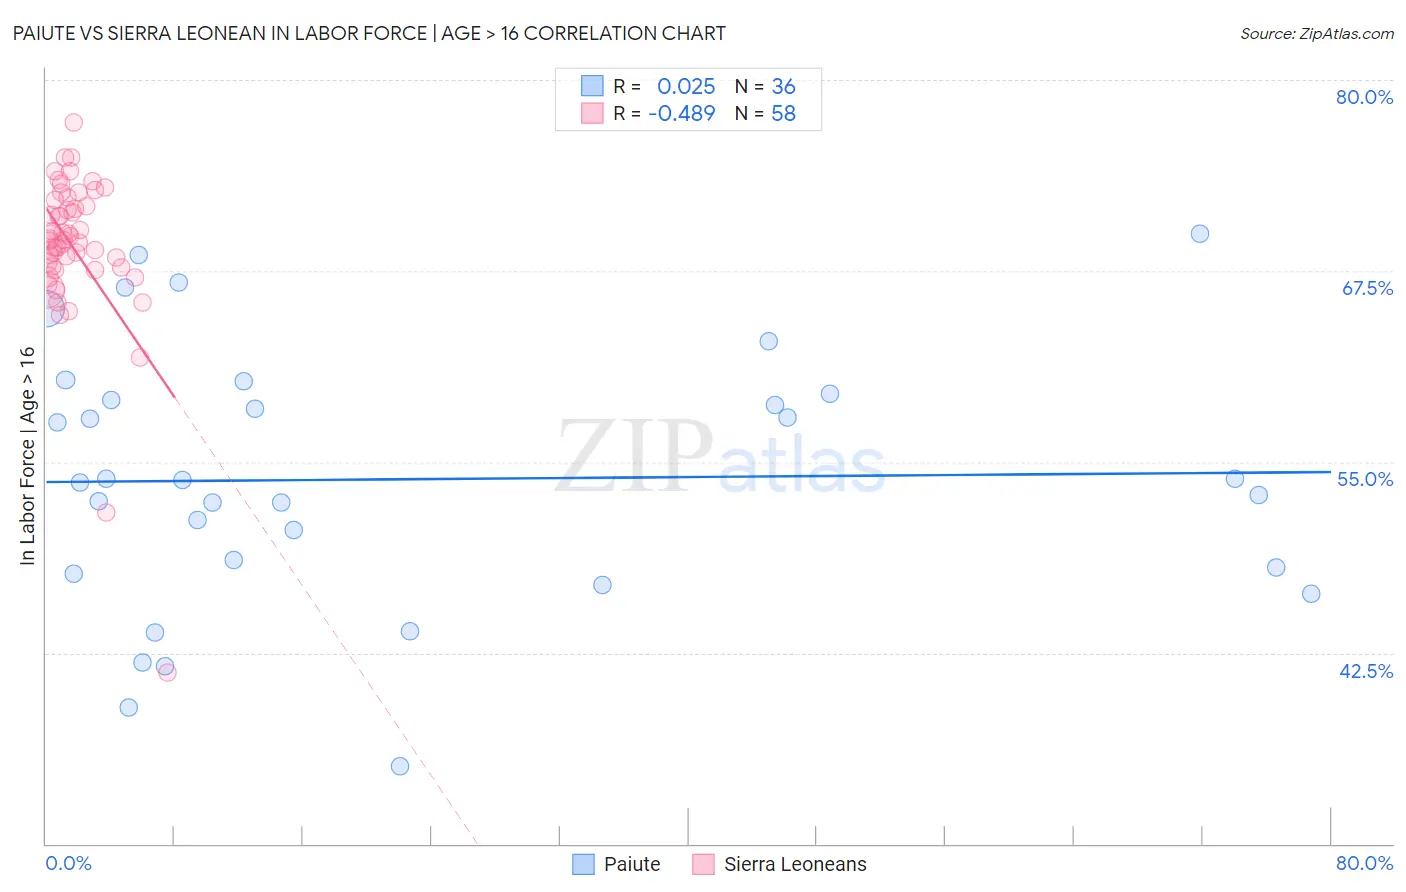
Paiute vs Sierra Leonean In Labor Force | Age > 16 Correlation Chart
The statistical analysis conducted on geographies consisting of 58,401,251 people shows no correlation between the proportion of Paiute and labor force participation rate among population ages 16 and over in the United States with a correlation coefficient (R) of 0.025 and weighted average of 60.7%. Similarly, the statistical analysis conducted on geographies consisting of 83,361,112 people shows a moderate negative correlation between the proportion of Sierra Leoneans and labor force participation rate among population ages 16 and over in the United States with a correlation coefficient (R) of -0.489 and weighted average of 68.9%, a difference of 13.5%.
In Labor Force | Age > 16 Correlation Summary
| Measurement | Paiute | Sierra Leonean |
| Minimum | 35.1% | 41.2% |
| Maximum | 69.9% | 77.2% |
| Range | 34.8% | 36.0% |
| Mean | 53.9% | 69.0% |
| Median | 53.7% | 69.5% |
| Interquartile 25% (IQ1) | 47.9% | 67.7% |
| Interquartile 75% (IQ3) | 59.2% | 71.7% |
| Interquartile Range (IQR) | 11.4% | 4.0% |
| Standard Deviation (Sample) | 8.5% | 5.3% |
| Standard Deviation (Population) | 8.4% | 5.2% |
Similar Demographics by In Labor Force | Age > 16
Demographics Similar to Paiute by In Labor Force | Age > 16
In terms of in labor force | age > 16, the demographic groups most similar to Paiute are Apache (60.7%, a difference of 0.050%), Crow (60.8%, a difference of 0.080%), Native/Alaskan (60.6%, a difference of 0.23%), Ute (60.9%, a difference of 0.26%), and Menominee (60.6%, a difference of 0.26%).
| Demographics | Rating | Rank | In Labor Force | Age > 16 |
| Sioux | 0.0 /100 | #326 | Tragic 61.8% |
| Cajuns | 0.0 /100 | #327 | Tragic 61.8% |
| Dutch West Indians | 0.0 /100 | #328 | Tragic 61.7% |
| Choctaw | 0.0 /100 | #329 | Tragic 61.5% |
| Creek | 0.0 /100 | #330 | Tragic 61.3% |
| Ute | 0.0 /100 | #331 | Tragic 60.9% |
| Crow | 0.0 /100 | #332 | Tragic 60.8% |
| Paiute | 0.0 /100 | #333 | Tragic 60.7% |
| Apache | 0.0 /100 | #334 | Tragic 60.7% |
| Natives/Alaskans | 0.0 /100 | #335 | Tragic 60.6% |
| Menominee | 0.0 /100 | #336 | Tragic 60.6% |
| Colville | 0.0 /100 | #337 | Tragic 59.8% |
| Immigrants | Yemen | 0.0 /100 | #338 | Tragic 59.6% |
| Houma | 0.0 /100 | #339 | Tragic 59.5% |
| Pueblo | 0.0 /100 | #340 | Tragic 59.3% |
Demographics Similar to Sierra Leoneans by In Labor Force | Age > 16
In terms of in labor force | age > 16, the demographic groups most similar to Sierra Leoneans are Immigrants from Eritrea (68.9%, a difference of 0.050%), Immigrants from Cameroon (68.7%, a difference of 0.30%), Immigrants from Somalia (69.1%, a difference of 0.31%), Somali (69.2%, a difference of 0.38%), and Ethiopian (69.3%, a difference of 0.58%).
| Demographics | Rating | Rank | In Labor Force | Age > 16 |
| Immigrants | Ethiopia | 100.0 /100 | #1 | Exceptional 69.4% |
| Ethiopians | 100.0 /100 | #2 | Exceptional 69.3% |
| Somalis | 100.0 /100 | #3 | Exceptional 69.2% |
| Immigrants | Somalia | 100.0 /100 | #4 | Exceptional 69.1% |
| Sierra Leoneans | 100.0 /100 | #5 | Exceptional 68.9% |
| Immigrants | Eritrea | 100.0 /100 | #6 | Exceptional 68.9% |
| Immigrants | Cameroon | 100.0 /100 | #7 | Exceptional 68.7% |
| Immigrants | Sierra Leone | 100.0 /100 | #8 | Exceptional 68.5% |
| Immigrants | Eastern Africa | 100.0 /100 | #9 | Exceptional 68.5% |
| Immigrants | Bolivia | 100.0 /100 | #10 | Exceptional 68.4% |
| Bolivians | 100.0 /100 | #11 | Exceptional 68.2% |
| Sudanese | 100.0 /100 | #12 | Exceptional 68.0% |
| Immigrants | Nepal | 100.0 /100 | #13 | Exceptional 68.0% |
| Liberians | 100.0 /100 | #14 | Exceptional 67.8% |
| Immigrants | Middle Africa | 100.0 /100 | #15 | Exceptional 67.7% |