Paiute vs Immigrants from Australia In Labor Force | Age > 16
COMPARE
Paiute
Immigrants from Australia
In Labor Force | Age > 16
In Labor Force | Age > 16 Comparison
Paiute
Immigrants from Australia
60.7%
IN LABOR FORCE | AGE > 16
0.0/ 100
METRIC RATING
333rd/ 347
METRIC RANK
65.9%
IN LABOR FORCE | AGE > 16
98.7/ 100
METRIC RATING
99th/ 347
METRIC RANK
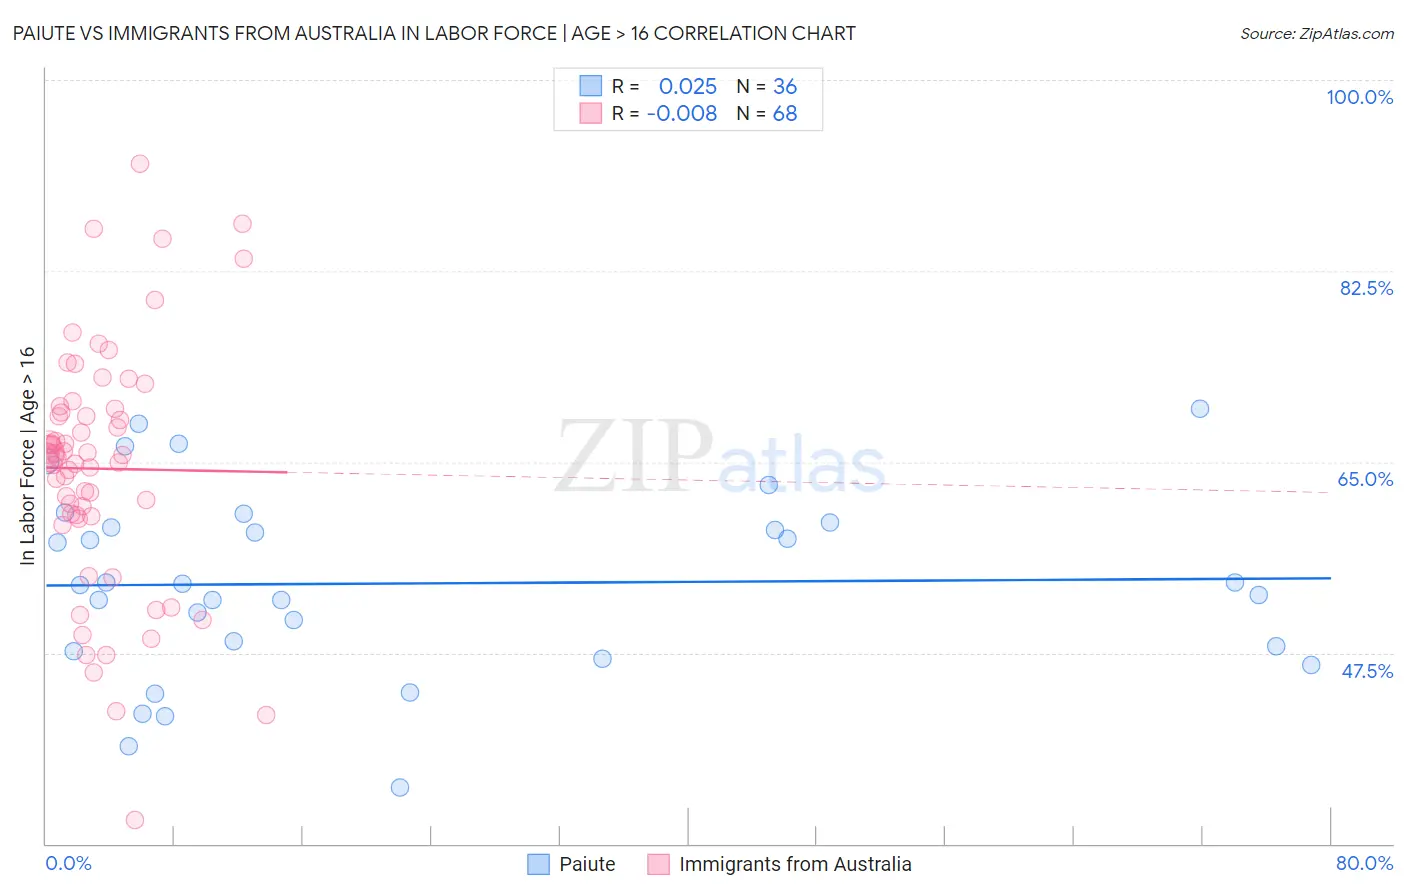
Paiute vs Immigrants from Australia In Labor Force | Age > 16 Correlation Chart
The statistical analysis conducted on geographies consisting of 58,401,251 people shows no correlation between the proportion of Paiute and labor force participation rate among population ages 16 and over in the United States with a correlation coefficient (R) of 0.025 and weighted average of 60.7%. Similarly, the statistical analysis conducted on geographies consisting of 227,207,882 people shows no correlation between the proportion of Immigrants from Australia and labor force participation rate among population ages 16 and over in the United States with a correlation coefficient (R) of -0.008 and weighted average of 65.9%, a difference of 8.5%.
In Labor Force | Age > 16 Correlation Summary
| Measurement | Paiute | Immigrants from Australia |
| Minimum | 35.1% | 32.2% |
| Maximum | 69.9% | 92.3% |
| Range | 34.8% | 60.1% |
| Mean | 53.9% | 64.4% |
| Median | 53.7% | 65.7% |
| Interquartile 25% (IQ1) | 47.9% | 60.1% |
| Interquartile 75% (IQ3) | 59.2% | 69.7% |
| Interquartile Range (IQR) | 11.4% | 9.6% |
| Standard Deviation (Sample) | 8.5% | 11.2% |
| Standard Deviation (Population) | 8.4% | 11.1% |
Similar Demographics by In Labor Force | Age > 16
Demographics Similar to Paiute by In Labor Force | Age > 16
In terms of in labor force | age > 16, the demographic groups most similar to Paiute are Apache (60.7%, a difference of 0.050%), Crow (60.8%, a difference of 0.080%), Native/Alaskan (60.6%, a difference of 0.23%), Ute (60.9%, a difference of 0.26%), and Menominee (60.6%, a difference of 0.26%).
| Demographics | Rating | Rank | In Labor Force | Age > 16 |
| Sioux | 0.0 /100 | #326 | Tragic 61.8% |
| Cajuns | 0.0 /100 | #327 | Tragic 61.8% |
| Dutch West Indians | 0.0 /100 | #328 | Tragic 61.7% |
| Choctaw | 0.0 /100 | #329 | Tragic 61.5% |
| Creek | 0.0 /100 | #330 | Tragic 61.3% |
| Ute | 0.0 /100 | #331 | Tragic 60.9% |
| Crow | 0.0 /100 | #332 | Tragic 60.8% |
| Paiute | 0.0 /100 | #333 | Tragic 60.7% |
| Apache | 0.0 /100 | #334 | Tragic 60.7% |
| Natives/Alaskans | 0.0 /100 | #335 | Tragic 60.6% |
| Menominee | 0.0 /100 | #336 | Tragic 60.6% |
| Colville | 0.0 /100 | #337 | Tragic 59.8% |
| Immigrants | Yemen | 0.0 /100 | #338 | Tragic 59.6% |
| Houma | 0.0 /100 | #339 | Tragic 59.5% |
| Pueblo | 0.0 /100 | #340 | Tragic 59.3% |
Demographics Similar to Immigrants from Australia by In Labor Force | Age > 16
In terms of in labor force | age > 16, the demographic groups most similar to Immigrants from Australia are Okinawan (65.9%, a difference of 0.0%), Immigrants from Chile (65.9%, a difference of 0.010%), Immigrants from Colombia (65.9%, a difference of 0.010%), Uruguayan (65.9%, a difference of 0.010%), and Immigrants from South Eastern Asia (65.9%, a difference of 0.030%).
| Demographics | Rating | Rank | In Labor Force | Age > 16 |
| Aleuts | 99.1 /100 | #92 | Exceptional 66.0% |
| Immigrants | South America | 99.1 /100 | #93 | Exceptional 66.0% |
| Immigrants | Cambodia | 99.1 /100 | #94 | Exceptional 66.0% |
| Immigrants | Uruguay | 99.1 /100 | #95 | Exceptional 66.0% |
| Bangladeshis | 98.9 /100 | #96 | Exceptional 65.9% |
| Filipinos | 98.9 /100 | #97 | Exceptional 65.9% |
| Immigrants | Chile | 98.7 /100 | #98 | Exceptional 65.9% |
| Immigrants | Australia | 98.7 /100 | #99 | Exceptional 65.9% |
| Okinawans | 98.7 /100 | #100 | Exceptional 65.9% |
| Immigrants | Colombia | 98.6 /100 | #101 | Exceptional 65.9% |
| Uruguayans | 98.6 /100 | #102 | Exceptional 65.9% |
| Immigrants | South Eastern Asia | 98.5 /100 | #103 | Exceptional 65.9% |
| Palestinians | 98.5 /100 | #104 | Exceptional 65.9% |
| Colombians | 98.4 /100 | #105 | Exceptional 65.9% |
| Immigrants | Serbia | 98.1 /100 | #106 | Exceptional 65.8% |