Paiute vs Delaware In Labor Force | Age > 16
COMPARE
Paiute
Delaware
In Labor Force | Age > 16
In Labor Force | Age > 16 Comparison
Paiute
Delaware
60.7%
IN LABOR FORCE | AGE > 16
0.0/ 100
METRIC RATING
333rd/ 347
METRIC RANK
63.6%
IN LABOR FORCE | AGE > 16
0.0/ 100
METRIC RATING
302nd/ 347
METRIC RANK
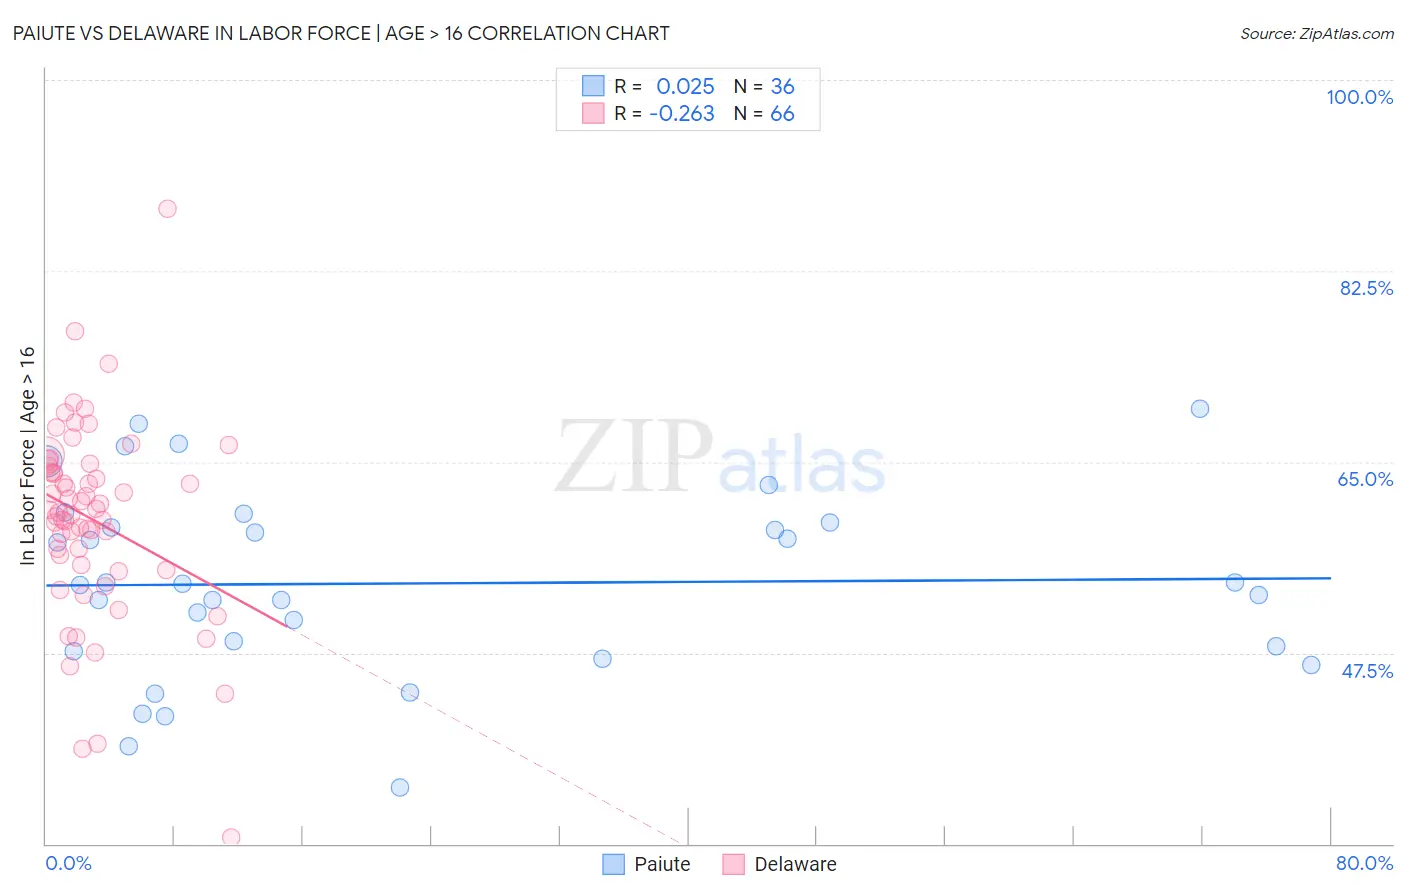
Paiute vs Delaware In Labor Force | Age > 16 Correlation Chart
The statistical analysis conducted on geographies consisting of 58,401,251 people shows no correlation between the proportion of Paiute and labor force participation rate among population ages 16 and over in the United States with a correlation coefficient (R) of 0.025 and weighted average of 60.7%. Similarly, the statistical analysis conducted on geographies consisting of 96,240,371 people shows a weak negative correlation between the proportion of Delaware and labor force participation rate among population ages 16 and over in the United States with a correlation coefficient (R) of -0.263 and weighted average of 63.6%, a difference of 4.7%.
In Labor Force | Age > 16 Correlation Summary
| Measurement | Paiute | Delaware |
| Minimum | 35.1% | 30.6% |
| Maximum | 69.9% | 88.2% |
| Range | 34.8% | 57.6% |
| Mean | 53.9% | 59.7% |
| Median | 53.7% | 60.5% |
| Interquartile 25% (IQ1) | 47.9% | 55.6% |
| Interquartile 75% (IQ3) | 59.2% | 64.6% |
| Interquartile Range (IQR) | 11.4% | 9.0% |
| Standard Deviation (Sample) | 8.5% | 9.0% |
| Standard Deviation (Population) | 8.4% | 9.0% |
Similar Demographics by In Labor Force | Age > 16
Demographics Similar to Paiute by In Labor Force | Age > 16
In terms of in labor force | age > 16, the demographic groups most similar to Paiute are Apache (60.7%, a difference of 0.050%), Crow (60.8%, a difference of 0.080%), Native/Alaskan (60.6%, a difference of 0.23%), Ute (60.9%, a difference of 0.26%), and Menominee (60.6%, a difference of 0.26%).
| Demographics | Rating | Rank | In Labor Force | Age > 16 |
| Sioux | 0.0 /100 | #326 | Tragic 61.8% |
| Cajuns | 0.0 /100 | #327 | Tragic 61.8% |
| Dutch West Indians | 0.0 /100 | #328 | Tragic 61.7% |
| Choctaw | 0.0 /100 | #329 | Tragic 61.5% |
| Creek | 0.0 /100 | #330 | Tragic 61.3% |
| Ute | 0.0 /100 | #331 | Tragic 60.9% |
| Crow | 0.0 /100 | #332 | Tragic 60.8% |
| Paiute | 0.0 /100 | #333 | Tragic 60.7% |
| Apache | 0.0 /100 | #334 | Tragic 60.7% |
| Natives/Alaskans | 0.0 /100 | #335 | Tragic 60.6% |
| Menominee | 0.0 /100 | #336 | Tragic 60.6% |
| Colville | 0.0 /100 | #337 | Tragic 59.8% |
| Immigrants | Yemen | 0.0 /100 | #338 | Tragic 59.6% |
| Houma | 0.0 /100 | #339 | Tragic 59.5% |
| Pueblo | 0.0 /100 | #340 | Tragic 59.3% |
Demographics Similar to Delaware by In Labor Force | Age > 16
In terms of in labor force | age > 16, the demographic groups most similar to Delaware are Spanish American (63.6%, a difference of 0.010%), Immigrants from the Azores (63.6%, a difference of 0.040%), Cree (63.5%, a difference of 0.040%), White/Caucasian (63.6%, a difference of 0.050%), and Nonimmigrants (63.5%, a difference of 0.090%).
| Demographics | Rating | Rank | In Labor Force | Age > 16 |
| Immigrants | Canada | 0.0 /100 | #295 | Tragic 63.7% |
| Immigrants | North America | 0.0 /100 | #296 | Tragic 63.7% |
| Immigrants | Grenada | 0.0 /100 | #297 | Tragic 63.6% |
| Comanche | 0.0 /100 | #298 | Tragic 63.6% |
| Whites/Caucasians | 0.0 /100 | #299 | Tragic 63.6% |
| Immigrants | Azores | 0.0 /100 | #300 | Tragic 63.6% |
| Spanish Americans | 0.0 /100 | #301 | Tragic 63.6% |
| Delaware | 0.0 /100 | #302 | Tragic 63.6% |
| Cree | 0.0 /100 | #303 | Tragic 63.5% |
| Immigrants | Nonimmigrants | 0.0 /100 | #304 | Tragic 63.5% |
| Osage | 0.0 /100 | #305 | Tragic 63.5% |
| Blacks/African Americans | 0.0 /100 | #306 | Tragic 63.4% |
| Central American Indians | 0.0 /100 | #307 | Tragic 63.4% |
| Pennsylvania Germans | 0.0 /100 | #308 | Tragic 63.4% |
| Scotch-Irish | 0.0 /100 | #309 | Tragic 63.3% |