Yaqui vs Sierra Leonean In Labor Force | Age > 16
COMPARE
Yaqui
Sierra Leonean
In Labor Force | Age > 16
In Labor Force | Age > 16 Comparison
Yaqui
Sierra Leoneans
63.0%
IN LABOR FORCE | AGE > 16
0.0/ 100
METRIC RATING
314th/ 347
METRIC RANK
68.9%
IN LABOR FORCE | AGE > 16
100.0/ 100
METRIC RATING
5th/ 347
METRIC RANK
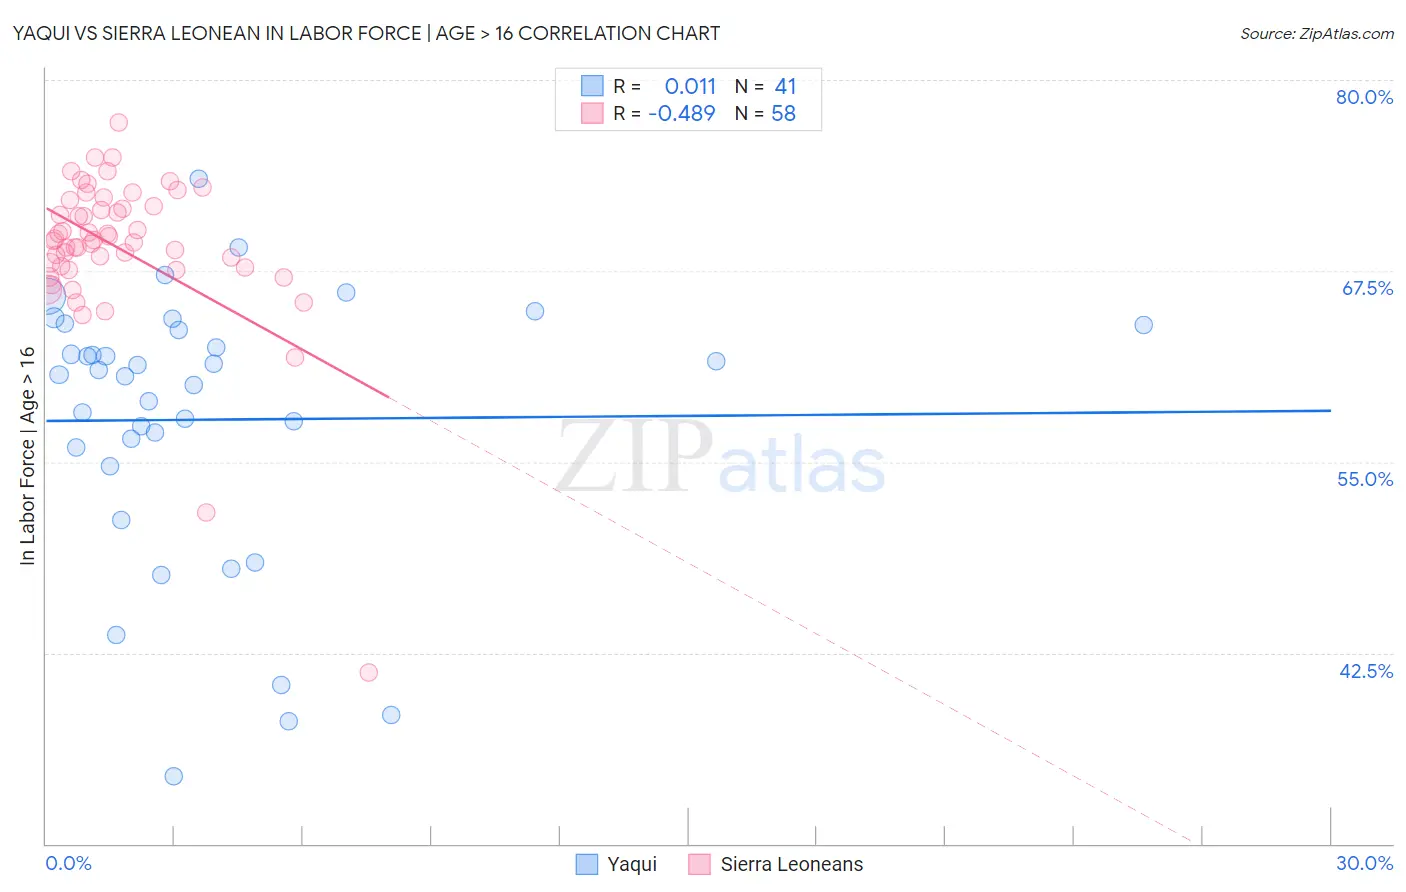
Yaqui vs Sierra Leonean In Labor Force | Age > 16 Correlation Chart
The statistical analysis conducted on geographies consisting of 107,721,250 people shows no correlation between the proportion of Yaqui and labor force participation rate among population ages 16 and over in the United States with a correlation coefficient (R) of 0.011 and weighted average of 63.0%. Similarly, the statistical analysis conducted on geographies consisting of 83,361,112 people shows a moderate negative correlation between the proportion of Sierra Leoneans and labor force participation rate among population ages 16 and over in the United States with a correlation coefficient (R) of -0.489 and weighted average of 68.9%, a difference of 9.3%.
In Labor Force | Age > 16 Correlation Summary
| Measurement | Yaqui | Sierra Leonean |
| Minimum | 34.4% | 41.2% |
| Maximum | 73.5% | 77.2% |
| Range | 39.1% | 36.0% |
| Mean | 57.8% | 69.0% |
| Median | 60.7% | 69.5% |
| Interquartile 25% (IQ1) | 55.3% | 67.7% |
| Interquartile 75% (IQ3) | 63.8% | 71.7% |
| Interquartile Range (IQR) | 8.5% | 4.0% |
| Standard Deviation (Sample) | 8.9% | 5.3% |
| Standard Deviation (Population) | 8.8% | 5.2% |
Similar Demographics by In Labor Force | Age > 16
Demographics Similar to Yaqui by In Labor Force | Age > 16
In terms of in labor force | age > 16, the demographic groups most similar to Yaqui are Chippewa (63.1%, a difference of 0.10%), Iroquois (63.2%, a difference of 0.23%), Blackfeet (63.2%, a difference of 0.29%), Shoshone (63.2%, a difference of 0.30%), and Potawatomi (62.8%, a difference of 0.35%).
| Demographics | Rating | Rank | In Labor Force | Age > 16 |
| Central American Indians | 0.0 /100 | #307 | Tragic 63.4% |
| Pennsylvania Germans | 0.0 /100 | #308 | Tragic 63.4% |
| Scotch-Irish | 0.0 /100 | #309 | Tragic 63.3% |
| Shoshone | 0.0 /100 | #310 | Tragic 63.2% |
| Blackfeet | 0.0 /100 | #311 | Tragic 63.2% |
| Iroquois | 0.0 /100 | #312 | Tragic 63.2% |
| Chippewa | 0.0 /100 | #313 | Tragic 63.1% |
| Yaqui | 0.0 /100 | #314 | Tragic 63.0% |
| Potawatomi | 0.0 /100 | #315 | Tragic 62.8% |
| Yup'ik | 0.0 /100 | #316 | Tragic 62.7% |
| Kiowa | 0.0 /100 | #317 | Tragic 62.4% |
| Chickasaw | 0.0 /100 | #318 | Tragic 62.3% |
| Arapaho | 0.0 /100 | #319 | Tragic 62.1% |
| Yakama | 0.0 /100 | #320 | Tragic 62.1% |
| Americans | 0.0 /100 | #321 | Tragic 62.1% |
Demographics Similar to Sierra Leoneans by In Labor Force | Age > 16
In terms of in labor force | age > 16, the demographic groups most similar to Sierra Leoneans are Immigrants from Eritrea (68.9%, a difference of 0.050%), Immigrants from Cameroon (68.7%, a difference of 0.30%), Immigrants from Somalia (69.1%, a difference of 0.31%), Somali (69.2%, a difference of 0.38%), and Ethiopian (69.3%, a difference of 0.58%).
| Demographics | Rating | Rank | In Labor Force | Age > 16 |
| Immigrants | Ethiopia | 100.0 /100 | #1 | Exceptional 69.4% |
| Ethiopians | 100.0 /100 | #2 | Exceptional 69.3% |
| Somalis | 100.0 /100 | #3 | Exceptional 69.2% |
| Immigrants | Somalia | 100.0 /100 | #4 | Exceptional 69.1% |
| Sierra Leoneans | 100.0 /100 | #5 | Exceptional 68.9% |
| Immigrants | Eritrea | 100.0 /100 | #6 | Exceptional 68.9% |
| Immigrants | Cameroon | 100.0 /100 | #7 | Exceptional 68.7% |
| Immigrants | Sierra Leone | 100.0 /100 | #8 | Exceptional 68.5% |
| Immigrants | Eastern Africa | 100.0 /100 | #9 | Exceptional 68.5% |
| Immigrants | Bolivia | 100.0 /100 | #10 | Exceptional 68.4% |
| Bolivians | 100.0 /100 | #11 | Exceptional 68.2% |
| Sudanese | 100.0 /100 | #12 | Exceptional 68.0% |
| Immigrants | Nepal | 100.0 /100 | #13 | Exceptional 68.0% |
| Liberians | 100.0 /100 | #14 | Exceptional 67.8% |
| Immigrants | Middle Africa | 100.0 /100 | #15 | Exceptional 67.7% |