Paiute vs Immigrants from Bosnia and Herzegovina Associate's Degree
COMPARE
Paiute
Immigrants from Bosnia and Herzegovina
Associate's Degree
Associate's Degree Comparison
Paiute
Immigrants from Bosnia and Herzegovina
36.4%
ASSOCIATE'S DEGREE
0.0/ 100
METRIC RATING
329th/ 347
METRIC RANK
46.3%
ASSOCIATE'S DEGREE
48.3/ 100
METRIC RATING
178th/ 347
METRIC RANK
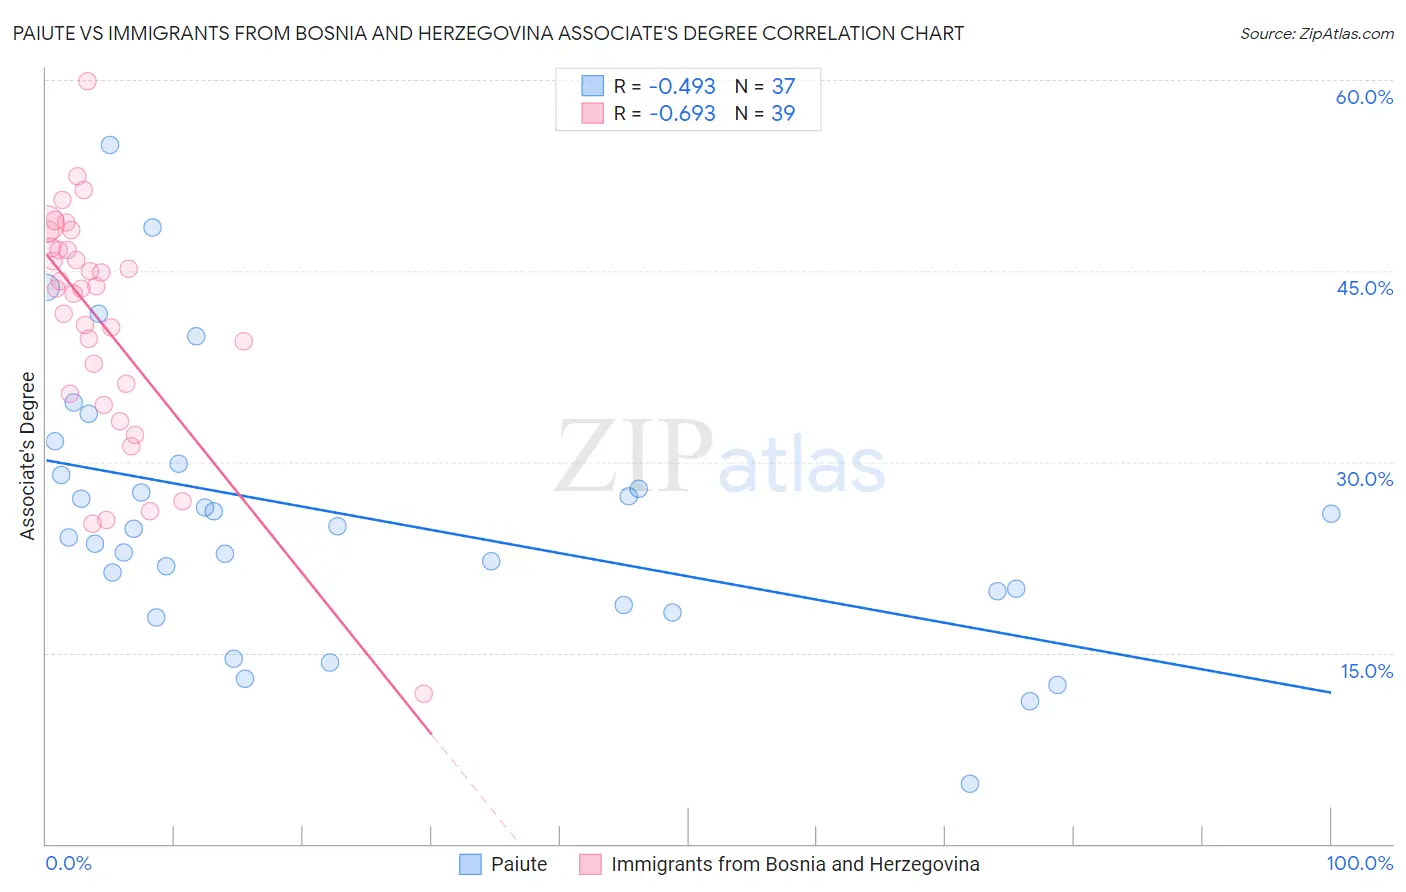
Paiute vs Immigrants from Bosnia and Herzegovina Associate's Degree Correlation Chart
The statistical analysis conducted on geographies consisting of 58,403,115 people shows a moderate negative correlation between the proportion of Paiute and percentage of population with at least associate's degree education in the United States with a correlation coefficient (R) of -0.493 and weighted average of 36.4%. Similarly, the statistical analysis conducted on geographies consisting of 156,817,312 people shows a significant negative correlation between the proportion of Immigrants from Bosnia and Herzegovina and percentage of population with at least associate's degree education in the United States with a correlation coefficient (R) of -0.693 and weighted average of 46.3%, a difference of 27.3%.
Associate's Degree Correlation Summary
| Measurement | Paiute | Immigrants from Bosnia and Herzegovina |
| Minimum | 4.8% | 11.8% |
| Maximum | 54.9% | 59.9% |
| Range | 50.2% | 48.2% |
| Mean | 25.6% | 41.0% |
| Median | 24.7% | 43.6% |
| Interquartile 25% (IQ1) | 19.3% | 35.3% |
| Interquartile 75% (IQ3) | 29.4% | 46.9% |
| Interquartile Range (IQR) | 10.1% | 11.5% |
| Standard Deviation (Sample) | 10.4% | 9.4% |
| Standard Deviation (Population) | 10.3% | 9.2% |
Similar Demographics by Associate's Degree
Demographics Similar to Paiute by Associate's Degree
In terms of associate's degree, the demographic groups most similar to Paiute are Alaskan Athabascan (36.5%, a difference of 0.29%), Dutch West Indian (36.5%, a difference of 0.30%), Apache (36.2%, a difference of 0.31%), Kiowa (36.5%, a difference of 0.32%), and Menominee (36.7%, a difference of 0.88%).
| Demographics | Rating | Rank | Associate's Degree |
| Pennsylvania Germans | 0.0 /100 | #322 | Tragic 37.2% |
| Immigrants | Cabo Verde | 0.0 /100 | #323 | Tragic 36.8% |
| Arapaho | 0.0 /100 | #324 | Tragic 36.7% |
| Menominee | 0.0 /100 | #325 | Tragic 36.7% |
| Kiowa | 0.0 /100 | #326 | Tragic 36.5% |
| Dutch West Indians | 0.0 /100 | #327 | Tragic 36.5% |
| Alaskan Athabascans | 0.0 /100 | #328 | Tragic 36.5% |
| Paiute | 0.0 /100 | #329 | Tragic 36.4% |
| Apache | 0.0 /100 | #330 | Tragic 36.2% |
| Immigrants | Azores | 0.0 /100 | #331 | Tragic 35.6% |
| Immigrants | Central America | 0.0 /100 | #332 | Tragic 35.0% |
| Mexicans | 0.0 /100 | #333 | Tragic 35.0% |
| Natives/Alaskans | 0.0 /100 | #334 | Tragic 34.9% |
| Spanish American Indians | 0.0 /100 | #335 | Tragic 34.9% |
| Hopi | 0.0 /100 | #336 | Tragic 34.6% |
Demographics Similar to Immigrants from Bosnia and Herzegovina by Associate's Degree
In terms of associate's degree, the demographic groups most similar to Immigrants from Bosnia and Herzegovina are Slovak (46.3%, a difference of 0.010%), Finnish (46.3%, a difference of 0.020%), Belgian (46.3%, a difference of 0.040%), Sri Lankan (46.3%, a difference of 0.050%), and English (46.4%, a difference of 0.13%).
| Demographics | Rating | Rank | Associate's Degree |
| Basques | 52.8 /100 | #171 | Average 46.5% |
| Peruvians | 50.5 /100 | #172 | Average 46.4% |
| Immigrants | Iraq | 50.3 /100 | #173 | Average 46.4% |
| English | 50.0 /100 | #174 | Average 46.4% |
| Belgians | 48.9 /100 | #175 | Average 46.3% |
| Finns | 48.5 /100 | #176 | Average 46.3% |
| Slovaks | 48.4 /100 | #177 | Average 46.3% |
| Immigrants | Bosnia and Herzegovina | 48.3 /100 | #178 | Average 46.3% |
| Sri Lankans | 47.6 /100 | #179 | Average 46.3% |
| Bermudans | 46.4 /100 | #180 | Average 46.2% |
| Immigrants | Colombia | 41.3 /100 | #181 | Average 46.0% |
| Swiss | 40.4 /100 | #182 | Average 46.0% |
| Yugoslavians | 40.2 /100 | #183 | Average 46.0% |
| Czechoslovakians | 40.0 /100 | #184 | Average 46.0% |
| Costa Ricans | 38.6 /100 | #185 | Fair 46.0% |