Subsaharan African vs Delaware In Labor Force | Age > 16
COMPARE
Subsaharan African
Delaware
In Labor Force | Age > 16
In Labor Force | Age > 16 Comparison
Sub-Saharan Africans
Delaware
66.2%
IN LABOR FORCE | AGE > 16
99.7/ 100
METRIC RATING
69th/ 347
METRIC RANK
63.6%
IN LABOR FORCE | AGE > 16
0.0/ 100
METRIC RATING
302nd/ 347
METRIC RANK
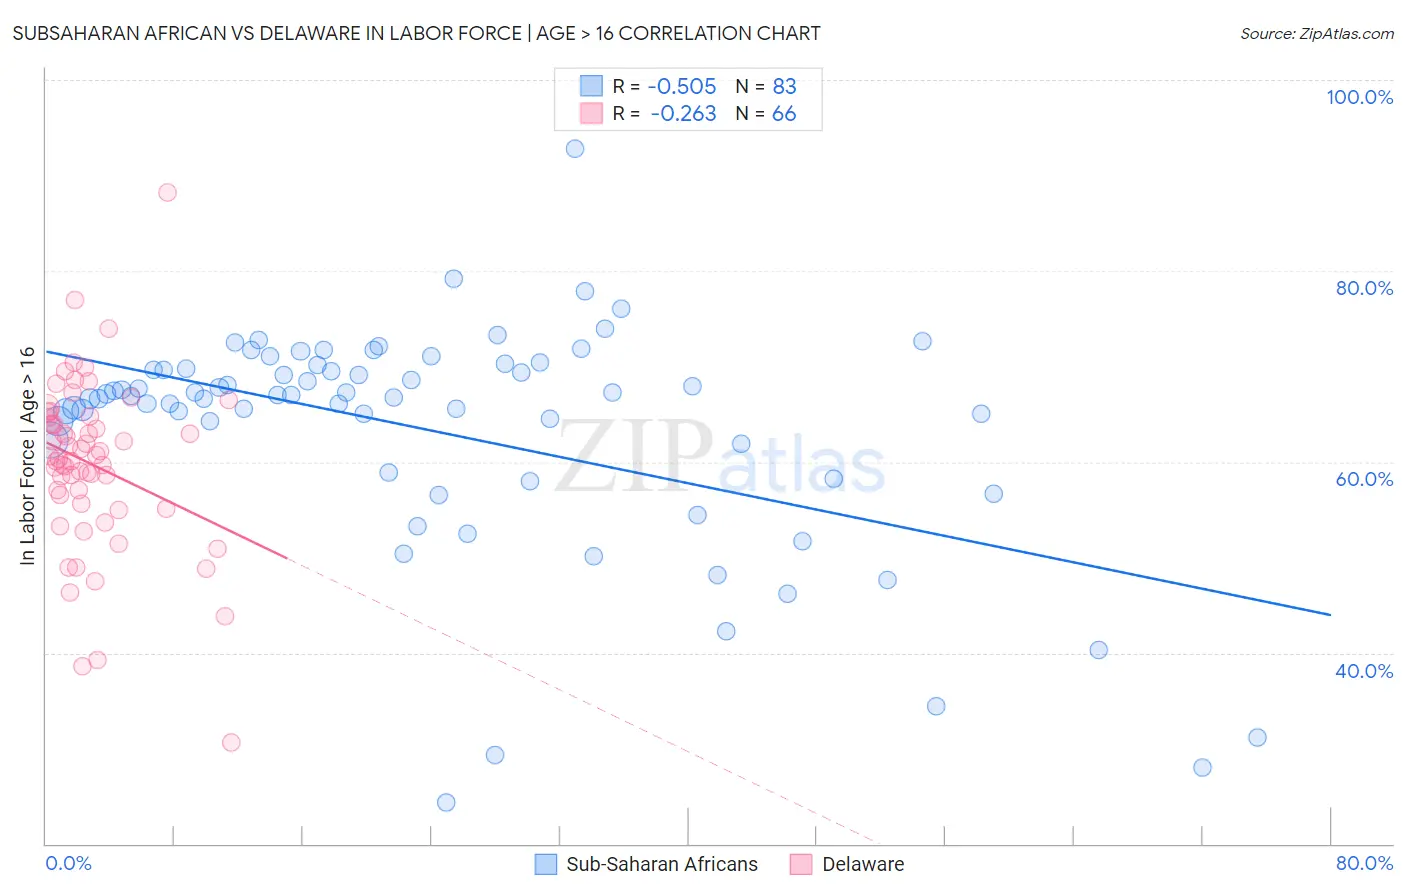
Subsaharan African vs Delaware In Labor Force | Age > 16 Correlation Chart
The statistical analysis conducted on geographies consisting of 508,218,371 people shows a substantial negative correlation between the proportion of Sub-Saharan Africans and labor force participation rate among population ages 16 and over in the United States with a correlation coefficient (R) of -0.505 and weighted average of 66.2%. Similarly, the statistical analysis conducted on geographies consisting of 96,240,371 people shows a weak negative correlation between the proportion of Delaware and labor force participation rate among population ages 16 and over in the United States with a correlation coefficient (R) of -0.263 and weighted average of 63.6%, a difference of 4.2%.
In Labor Force | Age > 16 Correlation Summary
| Measurement | Subsaharan African | Delaware |
| Minimum | 24.3% | 30.6% |
| Maximum | 92.8% | 88.2% |
| Range | 68.5% | 57.6% |
| Mean | 63.3% | 59.7% |
| Median | 66.9% | 60.5% |
| Interquartile 25% (IQ1) | 58.8% | 55.6% |
| Interquartile 75% (IQ3) | 69.8% | 64.6% |
| Interquartile Range (IQR) | 11.0% | 9.0% |
| Standard Deviation (Sample) | 12.0% | 9.0% |
| Standard Deviation (Population) | 11.9% | 9.0% |
Similar Demographics by In Labor Force | Age > 16
Demographics Similar to Sub-Saharan Africans by In Labor Force | Age > 16
In terms of in labor force | age > 16, the demographic groups most similar to Sub-Saharan Africans are Immigrants from Egypt (66.2%, a difference of 0.0%), Asian (66.2%, a difference of 0.010%), Burmese (66.2%, a difference of 0.030%), Taiwanese (66.2%, a difference of 0.030%), and Immigrants from Vietnam (66.2%, a difference of 0.040%).
| Demographics | Rating | Rank | In Labor Force | Age > 16 |
| Indonesians | 99.8 /100 | #62 | Exceptional 66.3% |
| Venezuelans | 99.8 /100 | #63 | Exceptional 66.3% |
| Peruvians | 99.8 /100 | #64 | Exceptional 66.3% |
| Sri Lankans | 99.8 /100 | #65 | Exceptional 66.3% |
| Jordanians | 99.8 /100 | #66 | Exceptional 66.3% |
| Egyptians | 99.8 /100 | #67 | Exceptional 66.2% |
| Immigrants | Egypt | 99.7 /100 | #68 | Exceptional 66.2% |
| Sub-Saharan Africans | 99.7 /100 | #69 | Exceptional 66.2% |
| Asians | 99.7 /100 | #70 | Exceptional 66.2% |
| Burmese | 99.7 /100 | #71 | Exceptional 66.2% |
| Taiwanese | 99.7 /100 | #72 | Exceptional 66.2% |
| Immigrants | Vietnam | 99.7 /100 | #73 | Exceptional 66.2% |
| Immigrants | Korea | 99.7 /100 | #74 | Exceptional 66.2% |
| Immigrants | Singapore | 99.7 /100 | #75 | Exceptional 66.2% |
| Immigrants | Malaysia | 99.6 /100 | #76 | Exceptional 66.1% |
Demographics Similar to Delaware by In Labor Force | Age > 16
In terms of in labor force | age > 16, the demographic groups most similar to Delaware are Spanish American (63.6%, a difference of 0.010%), Immigrants from the Azores (63.6%, a difference of 0.040%), Cree (63.5%, a difference of 0.040%), White/Caucasian (63.6%, a difference of 0.050%), and Nonimmigrants (63.5%, a difference of 0.090%).
| Demographics | Rating | Rank | In Labor Force | Age > 16 |
| Immigrants | Canada | 0.0 /100 | #295 | Tragic 63.7% |
| Immigrants | North America | 0.0 /100 | #296 | Tragic 63.7% |
| Immigrants | Grenada | 0.0 /100 | #297 | Tragic 63.6% |
| Comanche | 0.0 /100 | #298 | Tragic 63.6% |
| Whites/Caucasians | 0.0 /100 | #299 | Tragic 63.6% |
| Immigrants | Azores | 0.0 /100 | #300 | Tragic 63.6% |
| Spanish Americans | 0.0 /100 | #301 | Tragic 63.6% |
| Delaware | 0.0 /100 | #302 | Tragic 63.6% |
| Cree | 0.0 /100 | #303 | Tragic 63.5% |
| Immigrants | Nonimmigrants | 0.0 /100 | #304 | Tragic 63.5% |
| Osage | 0.0 /100 | #305 | Tragic 63.5% |
| Blacks/African Americans | 0.0 /100 | #306 | Tragic 63.4% |
| Central American Indians | 0.0 /100 | #307 | Tragic 63.4% |
| Pennsylvania Germans | 0.0 /100 | #308 | Tragic 63.4% |
| Scotch-Irish | 0.0 /100 | #309 | Tragic 63.3% |