Paiute vs Delaware Unemployment Among Women with Children Under 6 years
COMPARE
Paiute
Delaware
Unemployment Among Women with Children Under 6 years
Unemployment Among Women with Children Under 6 years Comparison
Paiute
Delaware
9.7%
UNEMPLOYMENT AMONG WOMEN WITH CHILDREN UNDER 6 YEARS
0.0/ 100
METRIC RATING
324th/ 347
METRIC RANK
9.8%
UNEMPLOYMENT AMONG WOMEN WITH CHILDREN UNDER 6 YEARS
0.0/ 100
METRIC RATING
326th/ 347
METRIC RANK
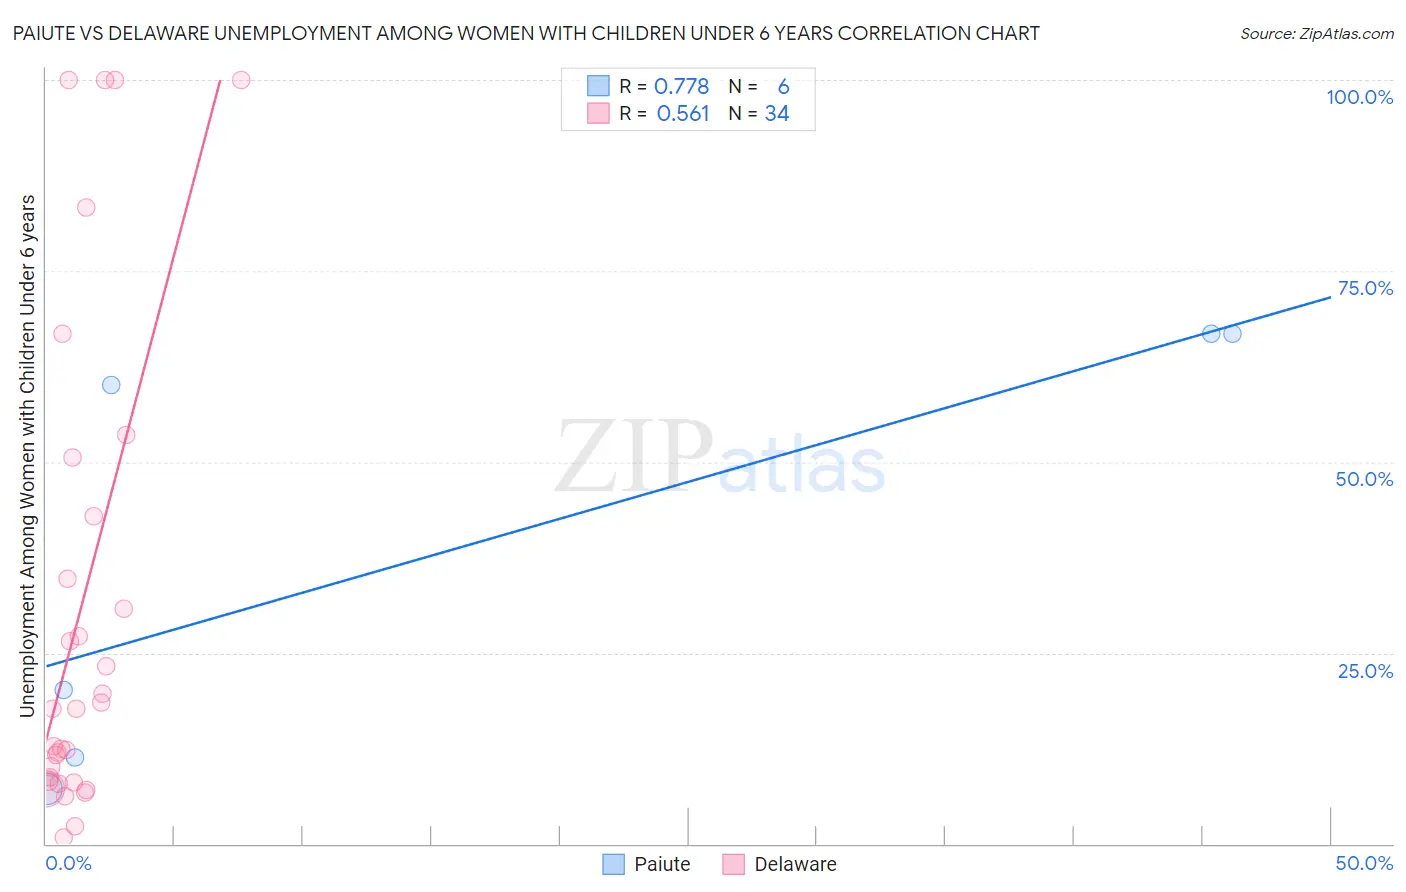
Paiute vs Delaware Unemployment Among Women with Children Under 6 years Correlation Chart
The statistical analysis conducted on geographies consisting of 54,107,424 people shows a strong positive correlation between the proportion of Paiute and unemployment rate among women with children under the age of 6 in the United States with a correlation coefficient (R) of 0.778 and weighted average of 9.7%. Similarly, the statistical analysis conducted on geographies consisting of 85,487,463 people shows a substantial positive correlation between the proportion of Delaware and unemployment rate among women with children under the age of 6 in the United States with a correlation coefficient (R) of 0.561 and weighted average of 9.8%, a difference of 0.98%.
Unemployment Among Women with Children Under 6 years Correlation Summary
| Measurement | Paiute | Delaware |
| Minimum | 7.2% | 0.90% |
| Maximum | 66.7% | 100.0% |
| Range | 59.5% | 99.1% |
| Mean | 38.7% | 30.8% |
| Median | 40.1% | 17.7% |
| Interquartile 25% (IQ1) | 11.3% | 8.2% |
| Interquartile 75% (IQ3) | 66.7% | 42.9% |
| Interquartile Range (IQR) | 55.4% | 34.7% |
| Standard Deviation (Sample) | 28.7% | 31.7% |
| Standard Deviation (Population) | 26.2% | 31.2% |
Demographics Similar to Paiute and Delaware by Unemployment Among Women with Children Under 6 years
In terms of unemployment among women with children under 6 years, the demographic groups most similar to Paiute are Immigrants from Bahamas (9.6%, a difference of 0.70%), Alaska Native (9.6%, a difference of 0.89%), Choctaw (9.8%, a difference of 0.95%), Central American Indian (9.6%, a difference of 1.1%), and Potawatomi (9.6%, a difference of 1.2%). Similarly, the demographic groups most similar to Delaware are Choctaw (9.8%, a difference of 0.030%), Ottawa (9.9%, a difference of 0.80%), Immigrants from Bahamas (9.6%, a difference of 1.7%), Alaska Native (9.6%, a difference of 1.9%), and Central American Indian (9.6%, a difference of 2.1%).
| Demographics | Rating | Rank | Unemployment Among Women with Children Under 6 years |
| Cherokee | 0.0 /100 | #315 | Tragic 9.3% |
| Houma | 0.0 /100 | #316 | Tragic 9.4% |
| Dutch West Indians | 0.0 /100 | #317 | Tragic 9.5% |
| Osage | 0.0 /100 | #318 | Tragic 9.5% |
| Marshallese | 0.0 /100 | #319 | Tragic 9.6% |
| Potawatomi | 0.0 /100 | #320 | Tragic 9.6% |
| Central American Indians | 0.0 /100 | #321 | Tragic 9.6% |
| Alaska Natives | 0.0 /100 | #322 | Tragic 9.6% |
| Immigrants | Bahamas | 0.0 /100 | #323 | Tragic 9.6% |
| Paiute | 0.0 /100 | #324 | Tragic 9.7% |
| Choctaw | 0.0 /100 | #325 | Tragic 9.8% |
| Delaware | 0.0 /100 | #326 | Tragic 9.8% |
| Ottawa | 0.0 /100 | #327 | Tragic 9.9% |
| Tohono O'odham | 0.0 /100 | #328 | Tragic 10.2% |
| Blacks/African Americans | 0.0 /100 | #329 | Tragic 10.3% |
| Pennsylvania Germans | 0.0 /100 | #330 | Tragic 10.8% |
| Colville | 0.0 /100 | #331 | Tragic 11.2% |
| Sioux | 0.0 /100 | #332 | Tragic 11.5% |
| Natives/Alaskans | 0.0 /100 | #333 | Tragic 11.5% |
| Apache | 0.0 /100 | #334 | Tragic 12.3% |
| Puerto Ricans | 0.0 /100 | #335 | Tragic 12.5% |