Ottawa vs Finnish In Labor Force | Age > 16
COMPARE
Ottawa
Finnish
In Labor Force | Age > 16
In Labor Force | Age > 16 Comparison
Ottawa
Finns
62.0%
IN LABOR FORCE | AGE > 16
0.0/ 100
METRIC RATING
322nd/ 347
METRIC RANK
64.2%
IN LABOR FORCE | AGE > 16
0.7/ 100
METRIC RATING
262nd/ 347
METRIC RANK
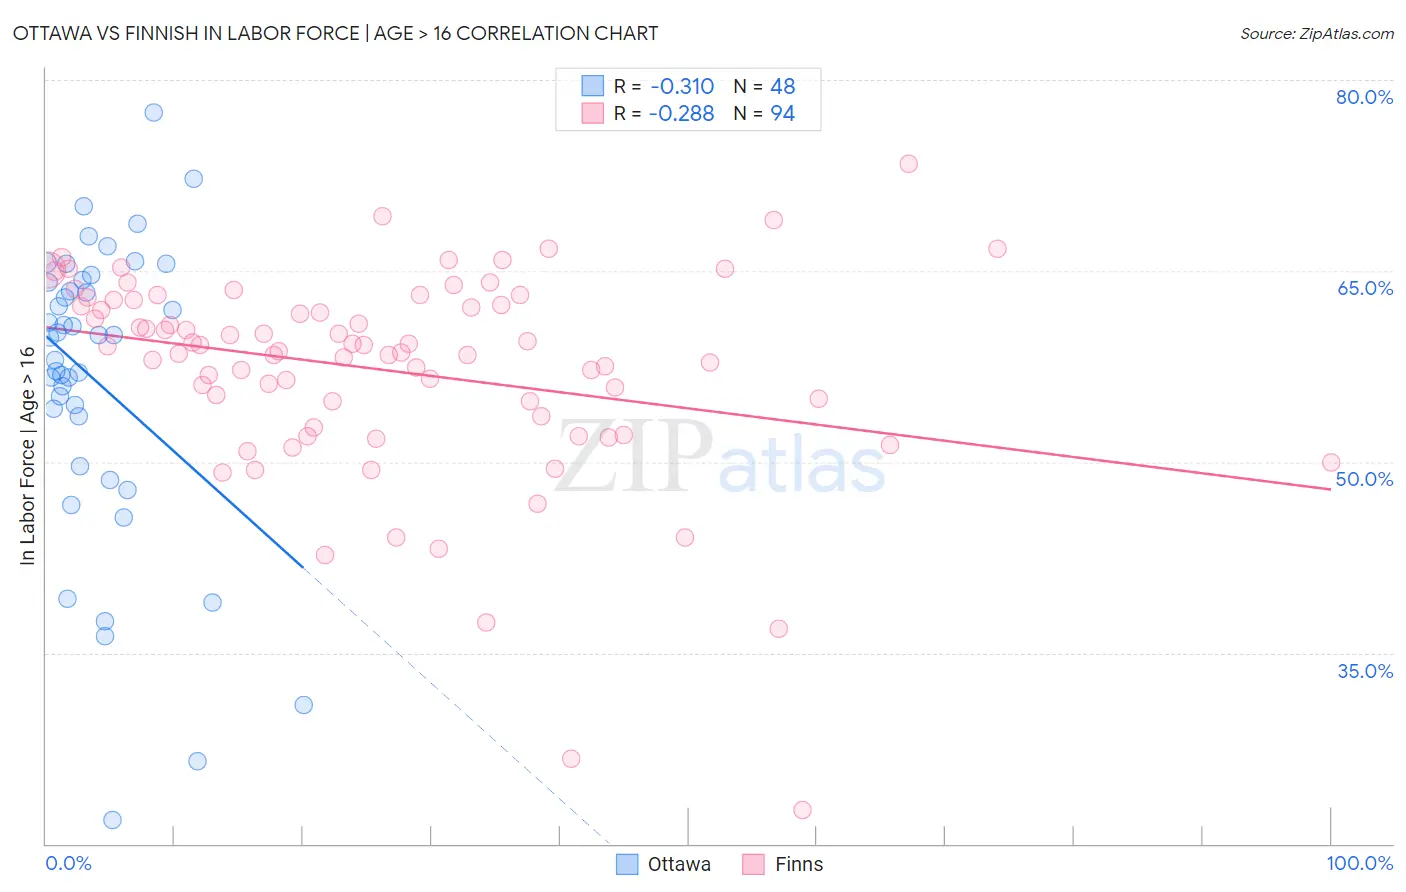
Ottawa vs Finnish In Labor Force | Age > 16 Correlation Chart
The statistical analysis conducted on geographies consisting of 49,955,399 people shows a mild negative correlation between the proportion of Ottawa and labor force participation rate among population ages 16 and over in the United States with a correlation coefficient (R) of -0.310 and weighted average of 62.0%. Similarly, the statistical analysis conducted on geographies consisting of 404,683,766 people shows a weak negative correlation between the proportion of Finns and labor force participation rate among population ages 16 and over in the United States with a correlation coefficient (R) of -0.288 and weighted average of 64.2%, a difference of 3.5%.
In Labor Force | Age > 16 Correlation Summary
| Measurement | Ottawa | Finnish |
| Minimum | 21.9% | 22.7% |
| Maximum | 77.4% | 73.4% |
| Range | 55.5% | 50.7% |
| Mean | 56.2% | 57.2% |
| Median | 59.9% | 58.9% |
| Interquartile 25% (IQ1) | 51.7% | 53.6% |
| Interquartile 75% (IQ3) | 64.2% | 62.7% |
| Interquartile Range (IQR) | 12.5% | 9.1% |
| Standard Deviation (Sample) | 11.9% | 8.3% |
| Standard Deviation (Population) | 11.7% | 8.2% |
Similar Demographics by In Labor Force | Age > 16
Demographics Similar to Ottawa by In Labor Force | Age > 16
In terms of in labor force | age > 16, the demographic groups most similar to Ottawa are Seminole (62.0%, a difference of 0.030%), Cheyenne (62.0%, a difference of 0.070%), Cherokee (61.9%, a difference of 0.11%), American (62.1%, a difference of 0.16%), and Yakama (62.1%, a difference of 0.19%).
| Demographics | Rating | Rank | In Labor Force | Age > 16 |
| Potawatomi | 0.0 /100 | #315 | Tragic 62.8% |
| Yup'ik | 0.0 /100 | #316 | Tragic 62.7% |
| Kiowa | 0.0 /100 | #317 | Tragic 62.4% |
| Chickasaw | 0.0 /100 | #318 | Tragic 62.3% |
| Arapaho | 0.0 /100 | #319 | Tragic 62.1% |
| Yakama | 0.0 /100 | #320 | Tragic 62.1% |
| Americans | 0.0 /100 | #321 | Tragic 62.1% |
| Ottawa | 0.0 /100 | #322 | Tragic 62.0% |
| Seminole | 0.0 /100 | #323 | Tragic 62.0% |
| Cheyenne | 0.0 /100 | #324 | Tragic 62.0% |
| Cherokee | 0.0 /100 | #325 | Tragic 61.9% |
| Sioux | 0.0 /100 | #326 | Tragic 61.8% |
| Cajuns | 0.0 /100 | #327 | Tragic 61.8% |
| Dutch West Indians | 0.0 /100 | #328 | Tragic 61.7% |
| Choctaw | 0.0 /100 | #329 | Tragic 61.5% |
Demographics Similar to Finns by In Labor Force | Age > 16
In terms of in labor force | age > 16, the demographic groups most similar to Finns are Marshallese (64.2%, a difference of 0.010%), Basque (64.2%, a difference of 0.010%), Bahamian (64.2%, a difference of 0.010%), Immigrants from Western Europe (64.2%, a difference of 0.020%), and Dutch (64.2%, a difference of 0.030%).
| Demographics | Rating | Rank | In Labor Force | Age > 16 |
| Hispanics or Latinos | 1.1 /100 | #255 | Tragic 64.3% |
| Immigrants | Mexico | 1.0 /100 | #256 | Tragic 64.3% |
| Inupiat | 0.8 /100 | #257 | Tragic 64.3% |
| Immigrants | Scotland | 0.8 /100 | #258 | Tragic 64.2% |
| Immigrants | Western Europe | 0.7 /100 | #259 | Tragic 64.2% |
| Marshallese | 0.7 /100 | #260 | Tragic 64.2% |
| Basques | 0.7 /100 | #261 | Tragic 64.2% |
| Finns | 0.7 /100 | #262 | Tragic 64.2% |
| Bahamians | 0.6 /100 | #263 | Tragic 64.2% |
| Dutch | 0.6 /100 | #264 | Tragic 64.2% |
| Cubans | 0.5 /100 | #265 | Tragic 64.2% |
| Immigrants | England | 0.5 /100 | #266 | Tragic 64.2% |
| Canadians | 0.5 /100 | #267 | Tragic 64.1% |
| Spaniards | 0.5 /100 | #268 | Tragic 64.1% |
| Irish | 0.4 /100 | #269 | Tragic 64.1% |