Ottawa vs Colville In Labor Force | Age > 16
COMPARE
Ottawa
Colville
In Labor Force | Age > 16
In Labor Force | Age > 16 Comparison
Ottawa
Colville
62.0%
IN LABOR FORCE | AGE > 16
0.0/ 100
METRIC RATING
322nd/ 347
METRIC RANK
59.8%
IN LABOR FORCE | AGE > 16
0.0/ 100
METRIC RATING
337th/ 347
METRIC RANK
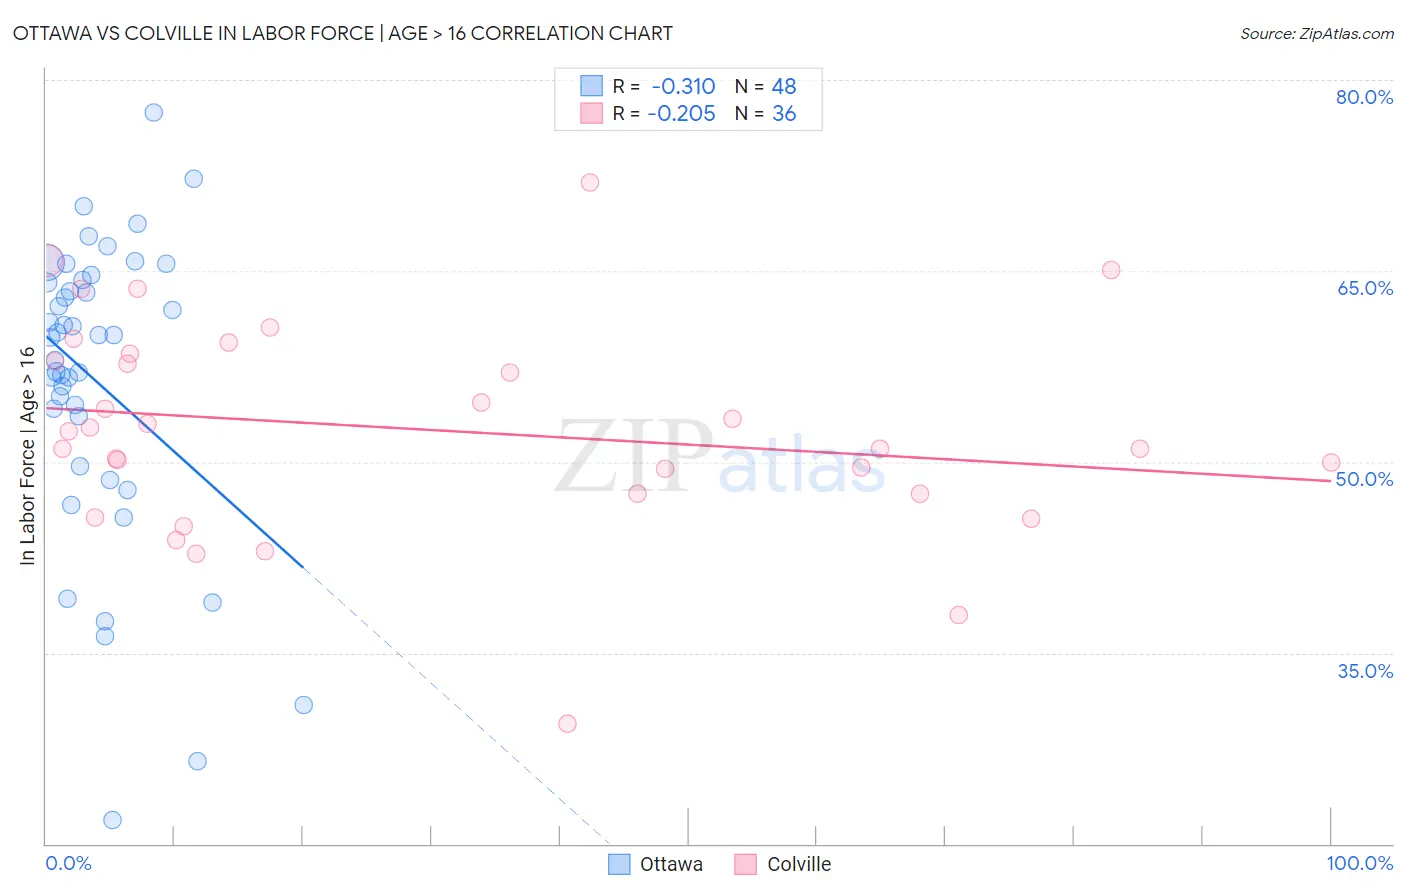
Ottawa vs Colville In Labor Force | Age > 16 Correlation Chart
The statistical analysis conducted on geographies consisting of 49,955,399 people shows a mild negative correlation between the proportion of Ottawa and labor force participation rate among population ages 16 and over in the United States with a correlation coefficient (R) of -0.310 and weighted average of 62.0%. Similarly, the statistical analysis conducted on geographies consisting of 34,687,961 people shows a weak negative correlation between the proportion of Colville and labor force participation rate among population ages 16 and over in the United States with a correlation coefficient (R) of -0.205 and weighted average of 59.8%, a difference of 3.7%.
In Labor Force | Age > 16 Correlation Summary
| Measurement | Ottawa | Colville |
| Minimum | 21.9% | 29.4% |
| Maximum | 77.4% | 71.9% |
| Range | 55.5% | 42.5% |
| Mean | 56.2% | 52.5% |
| Median | 59.9% | 51.7% |
| Interquartile 25% (IQ1) | 51.7% | 47.5% |
| Interquartile 75% (IQ3) | 64.2% | 58.2% |
| Interquartile Range (IQR) | 12.5% | 10.7% |
| Standard Deviation (Sample) | 11.9% | 8.4% |
| Standard Deviation (Population) | 11.7% | 8.3% |
Demographics Similar to Ottawa and Colville by In Labor Force | Age > 16
In terms of in labor force | age > 16, the demographic groups most similar to Ottawa are Seminole (62.0%, a difference of 0.030%), Cheyenne (62.0%, a difference of 0.070%), Cherokee (61.9%, a difference of 0.11%), American (62.1%, a difference of 0.16%), and Yakama (62.1%, a difference of 0.19%). Similarly, the demographic groups most similar to Colville are Immigrants from Yemen (59.6%, a difference of 0.27%), Houma (59.5%, a difference of 0.52%), Menominee (60.6%, a difference of 1.3%), Native/Alaskan (60.6%, a difference of 1.3%), and Apache (60.7%, a difference of 1.5%).
| Demographics | Rating | Rank | In Labor Force | Age > 16 |
| Arapaho | 0.0 /100 | #319 | Tragic 62.1% |
| Yakama | 0.0 /100 | #320 | Tragic 62.1% |
| Americans | 0.0 /100 | #321 | Tragic 62.1% |
| Ottawa | 0.0 /100 | #322 | Tragic 62.0% |
| Seminole | 0.0 /100 | #323 | Tragic 62.0% |
| Cheyenne | 0.0 /100 | #324 | Tragic 62.0% |
| Cherokee | 0.0 /100 | #325 | Tragic 61.9% |
| Sioux | 0.0 /100 | #326 | Tragic 61.8% |
| Cajuns | 0.0 /100 | #327 | Tragic 61.8% |
| Dutch West Indians | 0.0 /100 | #328 | Tragic 61.7% |
| Choctaw | 0.0 /100 | #329 | Tragic 61.5% |
| Creek | 0.0 /100 | #330 | Tragic 61.3% |
| Ute | 0.0 /100 | #331 | Tragic 60.9% |
| Crow | 0.0 /100 | #332 | Tragic 60.8% |
| Paiute | 0.0 /100 | #333 | Tragic 60.7% |
| Apache | 0.0 /100 | #334 | Tragic 60.7% |
| Natives/Alaskans | 0.0 /100 | #335 | Tragic 60.6% |
| Menominee | 0.0 /100 | #336 | Tragic 60.6% |
| Colville | 0.0 /100 | #337 | Tragic 59.8% |
| Immigrants | Yemen | 0.0 /100 | #338 | Tragic 59.6% |
| Houma | 0.0 /100 | #339 | Tragic 59.5% |