Polish vs Immigrants from Spain In Labor Force | Age 35-44
COMPARE
Polish
Immigrants from Spain
In Labor Force | Age 35-44
In Labor Force | Age 35-44 Comparison
Poles
Immigrants from Spain
85.2%
IN LABOR FORCE | AGE 35-44
99.8/ 100
METRIC RATING
43rd/ 347
METRIC RANK
84.7%
IN LABOR FORCE | AGE 35-44
90.6/ 100
METRIC RATING
127th/ 347
METRIC RANK
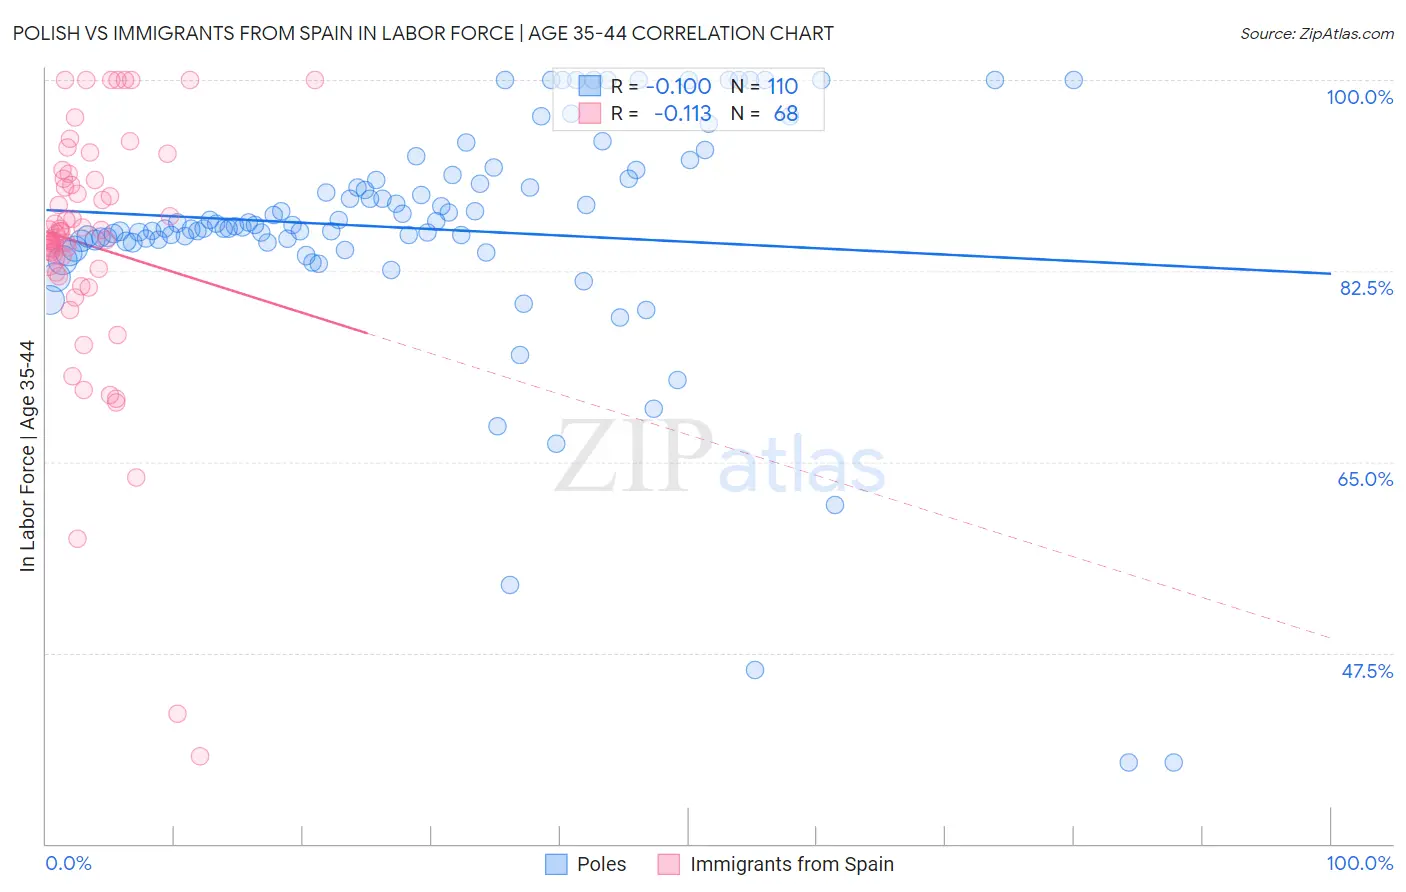
Polish vs Immigrants from Spain In Labor Force | Age 35-44 Correlation Chart
The statistical analysis conducted on geographies consisting of 559,917,844 people shows a poor negative correlation between the proportion of Poles and labor force participation rate among population between the ages 35 and 44 in the United States with a correlation coefficient (R) of -0.100 and weighted average of 85.2%. Similarly, the statistical analysis conducted on geographies consisting of 239,621,275 people shows a poor negative correlation between the proportion of Immigrants from Spain and labor force participation rate among population between the ages 35 and 44 in the United States with a correlation coefficient (R) of -0.113 and weighted average of 84.7%, a difference of 0.63%.
In Labor Force | Age 35-44 Correlation Summary
| Measurement | Polish | Immigrants from Spain |
| Minimum | 37.5% | 38.0% |
| Maximum | 100.0% | 100.0% |
| Range | 62.5% | 62.0% |
| Mean | 86.4% | 84.9% |
| Median | 86.6% | 86.0% |
| Interquartile 25% (IQ1) | 85.2% | 82.5% |
| Interquartile 75% (IQ3) | 90.9% | 90.9% |
| Interquartile Range (IQR) | 5.7% | 8.4% |
| Standard Deviation (Sample) | 11.1% | 11.7% |
| Standard Deviation (Population) | 11.1% | 11.6% |
Similar Demographics by In Labor Force | Age 35-44
Demographics Similar to Poles by In Labor Force | Age 35-44
In terms of in labor force | age 35-44, the demographic groups most similar to Poles are Lithuanian (85.2%, a difference of 0.0%), Immigrants from Bulgaria (85.2%, a difference of 0.010%), Immigrants from Zimbabwe (85.2%, a difference of 0.010%), Macedonian (85.2%, a difference of 0.010%), and Immigrants from Poland (85.2%, a difference of 0.020%).
| Demographics | Rating | Rank | In Labor Force | Age 35-44 |
| Immigrants | Morocco | 99.8 /100 | #36 | Exceptional 85.2% |
| Kenyans | 99.8 /100 | #37 | Exceptional 85.2% |
| Immigrants | Poland | 99.8 /100 | #38 | Exceptional 85.2% |
| Eastern Europeans | 99.8 /100 | #39 | Exceptional 85.2% |
| Immigrants | Bulgaria | 99.8 /100 | #40 | Exceptional 85.2% |
| Immigrants | Zimbabwe | 99.8 /100 | #41 | Exceptional 85.2% |
| Macedonians | 99.8 /100 | #42 | Exceptional 85.2% |
| Poles | 99.8 /100 | #43 | Exceptional 85.2% |
| Lithuanians | 99.8 /100 | #44 | Exceptional 85.2% |
| Cypriots | 99.8 /100 | #45 | Exceptional 85.2% |
| Immigrants | Hong Kong | 99.8 /100 | #46 | Exceptional 85.2% |
| German Russians | 99.8 /100 | #47 | Exceptional 85.2% |
| Immigrants | Eritrea | 99.7 /100 | #48 | Exceptional 85.2% |
| Croatians | 99.7 /100 | #49 | Exceptional 85.2% |
| Thais | 99.7 /100 | #50 | Exceptional 85.2% |
Demographics Similar to Immigrants from Spain by In Labor Force | Age 35-44
In terms of in labor force | age 35-44, the demographic groups most similar to Immigrants from Spain are Slavic (84.7%, a difference of 0.0%), Maltese (84.7%, a difference of 0.0%), Asian (84.7%, a difference of 0.0%), Immigrants from Ghana (84.7%, a difference of 0.0%), and Finnish (84.7%, a difference of 0.010%).
| Demographics | Rating | Rank | In Labor Force | Age 35-44 |
| Immigrants | Northern Europe | 91.5 /100 | #120 | Exceptional 84.7% |
| Finns | 91.2 /100 | #121 | Exceptional 84.7% |
| Germans | 91.0 /100 | #122 | Exceptional 84.7% |
| Immigrants | South America | 90.9 /100 | #123 | Exceptional 84.7% |
| Slavs | 90.8 /100 | #124 | Exceptional 84.7% |
| Maltese | 90.8 /100 | #125 | Exceptional 84.7% |
| Asians | 90.6 /100 | #126 | Exceptional 84.7% |
| Immigrants | Spain | 90.6 /100 | #127 | Exceptional 84.7% |
| Immigrants | Ghana | 90.4 /100 | #128 | Exceptional 84.7% |
| Palestinians | 89.7 /100 | #129 | Excellent 84.7% |
| Bhutanese | 89.7 /100 | #130 | Excellent 84.7% |
| Immigrants | Scotland | 89.6 /100 | #131 | Excellent 84.7% |
| Austrians | 89.4 /100 | #132 | Excellent 84.7% |
| Argentineans | 88.4 /100 | #133 | Excellent 84.6% |
| Immigrants | Korea | 88.2 /100 | #134 | Excellent 84.6% |