Ottawa vs Finnish In Labor Force | Age 30-34
COMPARE
Ottawa
Finnish
In Labor Force | Age 30-34
In Labor Force | Age 30-34 Comparison
Ottawa
Finns
82.4%
IN LABOR FORCE | AGE 30-34
0.0/ 100
METRIC RATING
302nd/ 347
METRIC RANK
84.7%
IN LABOR FORCE | AGE 30-34
50.0/ 100
METRIC RATING
174th/ 347
METRIC RANK
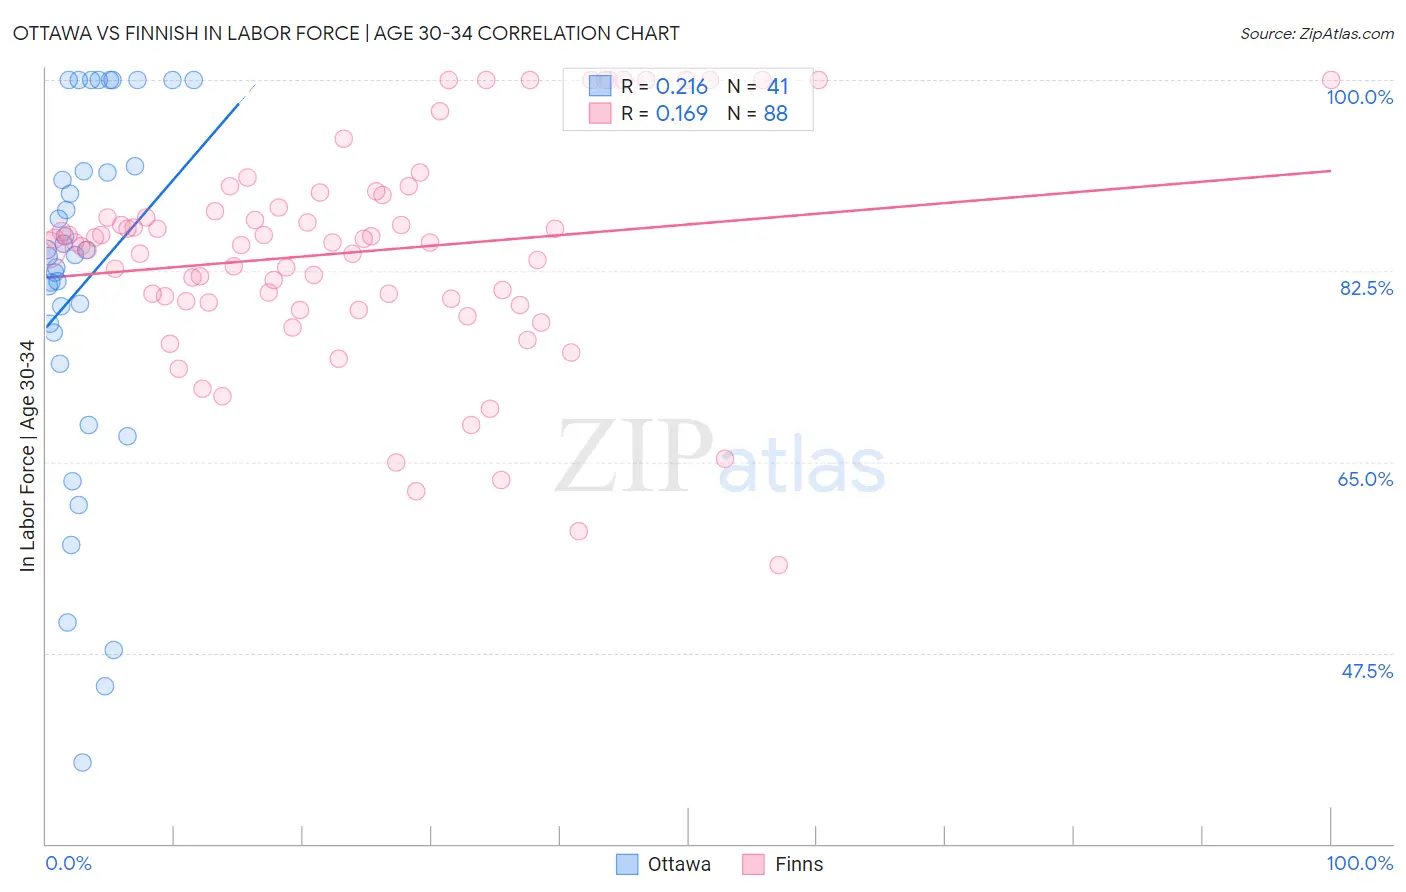
Ottawa vs Finnish In Labor Force | Age 30-34 Correlation Chart
The statistical analysis conducted on geographies consisting of 49,951,540 people shows a weak positive correlation between the proportion of Ottawa and labor force participation rate among population between the ages 30 and 34 in the United States with a correlation coefficient (R) of 0.216 and weighted average of 82.4%. Similarly, the statistical analysis conducted on geographies consisting of 404,404,222 people shows a poor positive correlation between the proportion of Finns and labor force participation rate among population between the ages 30 and 34 in the United States with a correlation coefficient (R) of 0.169 and weighted average of 84.7%, a difference of 2.8%.
In Labor Force | Age 30-34 Correlation Summary
| Measurement | Ottawa | Finnish |
| Minimum | 37.5% | 55.6% |
| Maximum | 100.0% | 100.0% |
| Range | 62.5% | 44.4% |
| Mean | 81.3% | 84.2% |
| Median | 84.0% | 85.1% |
| Interquartile 25% (IQ1) | 75.4% | 79.7% |
| Interquartile 75% (IQ3) | 91.9% | 88.9% |
| Interquartile Range (IQR) | 16.5% | 9.2% |
| Standard Deviation (Sample) | 16.5% | 9.9% |
| Standard Deviation (Population) | 16.3% | 9.9% |
Similar Demographics by In Labor Force | Age 30-34
Demographics Similar to Ottawa by In Labor Force | Age 30-34
In terms of in labor force | age 30-34, the demographic groups most similar to Ottawa are Immigrants from Micronesia (82.4%, a difference of 0.010%), Hispanic or Latino (82.4%, a difference of 0.030%), Hmong (82.4%, a difference of 0.040%), Tlingit-Haida (82.3%, a difference of 0.090%), and Immigrants from Central America (82.5%, a difference of 0.10%).
| Demographics | Rating | Rank | In Labor Force | Age 30-34 |
| Pennsylvania Germans | 0.0 /100 | #295 | Tragic 82.6% |
| Chippewa | 0.0 /100 | #296 | Tragic 82.6% |
| Comanche | 0.0 /100 | #297 | Tragic 82.6% |
| Aleuts | 0.0 /100 | #298 | Tragic 82.6% |
| Immigrants | Central America | 0.0 /100 | #299 | Tragic 82.5% |
| Hmong | 0.0 /100 | #300 | Tragic 82.4% |
| Hispanics or Latinos | 0.0 /100 | #301 | Tragic 82.4% |
| Ottawa | 0.0 /100 | #302 | Tragic 82.4% |
| Immigrants | Micronesia | 0.0 /100 | #303 | Tragic 82.4% |
| Tlingit-Haida | 0.0 /100 | #304 | Tragic 82.3% |
| Osage | 0.0 /100 | #305 | Tragic 82.3% |
| Spanish American Indians | 0.0 /100 | #306 | Tragic 82.2% |
| Menominee | 0.0 /100 | #307 | Tragic 82.2% |
| Puget Sound Salish | 0.0 /100 | #308 | Tragic 82.1% |
| Immigrants | Mexico | 0.0 /100 | #309 | Tragic 82.0% |
Demographics Similar to Finns by In Labor Force | Age 30-34
In terms of in labor force | age 30-34, the demographic groups most similar to Finns are Immigrants from South America (84.7%, a difference of 0.0%), Immigrants from Burma/Myanmar (84.7%, a difference of 0.010%), Irish (84.7%, a difference of 0.010%), Immigrants from England (84.7%, a difference of 0.010%), and Israeli (84.7%, a difference of 0.010%).
| Demographics | Rating | Rank | In Labor Force | Age 30-34 |
| Immigrants | South Eastern Asia | 54.2 /100 | #167 | Average 84.7% |
| Immigrants | Peru | 52.4 /100 | #168 | Average 84.7% |
| South American Indians | 52.1 /100 | #169 | Average 84.7% |
| Immigrants | Burma/Myanmar | 52.0 /100 | #170 | Average 84.7% |
| Irish | 52.0 /100 | #171 | Average 84.7% |
| Immigrants | England | 51.7 /100 | #172 | Average 84.7% |
| Israelis | 51.1 /100 | #173 | Average 84.7% |
| Finns | 50.0 /100 | #174 | Average 84.7% |
| Immigrants | South America | 50.0 /100 | #175 | Average 84.7% |
| Immigrants | Uzbekistan | 49.1 /100 | #176 | Average 84.7% |
| Laotians | 46.9 /100 | #177 | Average 84.7% |
| Okinawans | 44.1 /100 | #178 | Average 84.6% |
| Immigrants | Nigeria | 42.5 /100 | #179 | Average 84.6% |
| Immigrants | Netherlands | 42.1 /100 | #180 | Average 84.6% |
| Moroccans | 40.3 /100 | #181 | Average 84.6% |