Native Hawaiian vs Finnish In Labor Force | Age > 16
COMPARE
Native Hawaiian
Finnish
In Labor Force | Age > 16
In Labor Force | Age > 16 Comparison
Native Hawaiians
Finns
64.1%
IN LABOR FORCE | AGE > 16
0.3/ 100
METRIC RATING
272nd/ 347
METRIC RANK
64.2%
IN LABOR FORCE | AGE > 16
0.7/ 100
METRIC RATING
262nd/ 347
METRIC RANK
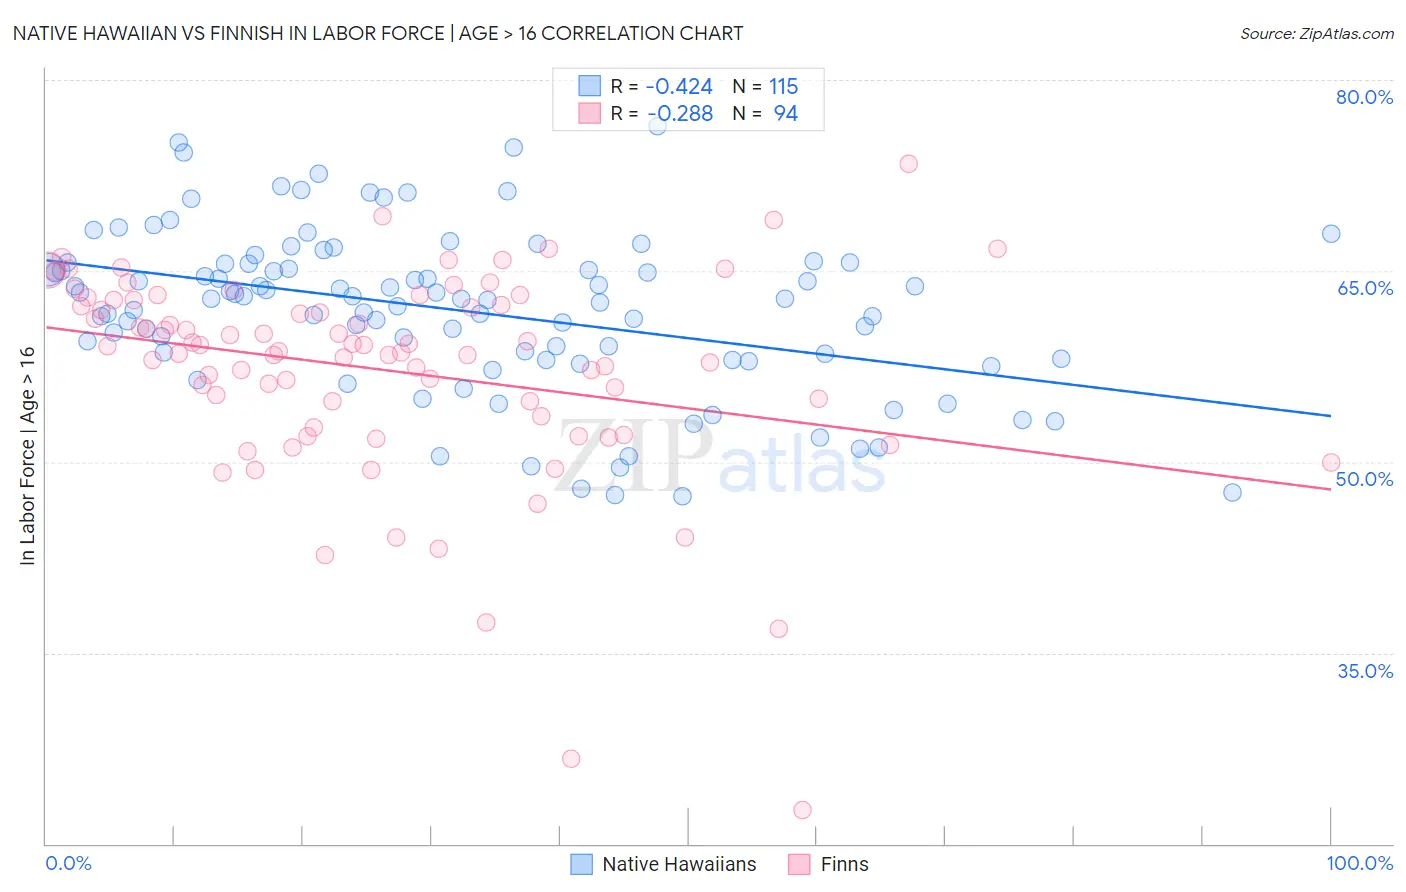
Native Hawaiian vs Finnish In Labor Force | Age > 16 Correlation Chart
The statistical analysis conducted on geographies consisting of 332,118,603 people shows a moderate negative correlation between the proportion of Native Hawaiians and labor force participation rate among population ages 16 and over in the United States with a correlation coefficient (R) of -0.424 and weighted average of 64.1%. Similarly, the statistical analysis conducted on geographies consisting of 404,683,766 people shows a weak negative correlation between the proportion of Finns and labor force participation rate among population ages 16 and over in the United States with a correlation coefficient (R) of -0.288 and weighted average of 64.2%, a difference of 0.20%.
In Labor Force | Age > 16 Correlation Summary
| Measurement | Native Hawaiian | Finnish |
| Minimum | 47.3% | 22.7% |
| Maximum | 76.4% | 73.4% |
| Range | 29.1% | 50.7% |
| Mean | 61.9% | 57.2% |
| Median | 62.8% | 58.9% |
| Interquartile 25% (IQ1) | 58.1% | 53.6% |
| Interquartile 75% (IQ3) | 65.6% | 62.7% |
| Interquartile Range (IQR) | 7.5% | 9.1% |
| Standard Deviation (Sample) | 6.3% | 8.3% |
| Standard Deviation (Population) | 6.3% | 8.2% |
Demographics Similar to Native Hawaiians and Finns by In Labor Force | Age > 16
In terms of in labor force | age > 16, the demographic groups most similar to Native Hawaiians are Hmong (64.1%, a difference of 0.0%), Immigrants from Cuba (64.1%, a difference of 0.020%), Mexican (64.1%, a difference of 0.020%), French American Indian (64.1%, a difference of 0.020%), and Guyanese (64.1%, a difference of 0.030%). Similarly, the demographic groups most similar to Finns are Marshallese (64.2%, a difference of 0.010%), Basque (64.2%, a difference of 0.010%), Bahamian (64.2%, a difference of 0.010%), Immigrants from Western Europe (64.2%, a difference of 0.020%), and Dutch (64.2%, a difference of 0.030%).
| Demographics | Rating | Rank | In Labor Force | Age > 16 |
| Inupiat | 0.8 /100 | #257 | Tragic 64.3% |
| Immigrants | Scotland | 0.8 /100 | #258 | Tragic 64.2% |
| Immigrants | Western Europe | 0.7 /100 | #259 | Tragic 64.2% |
| Marshallese | 0.7 /100 | #260 | Tragic 64.2% |
| Basques | 0.7 /100 | #261 | Tragic 64.2% |
| Finns | 0.7 /100 | #262 | Tragic 64.2% |
| Bahamians | 0.6 /100 | #263 | Tragic 64.2% |
| Dutch | 0.6 /100 | #264 | Tragic 64.2% |
| Cubans | 0.5 /100 | #265 | Tragic 64.2% |
| Immigrants | England | 0.5 /100 | #266 | Tragic 64.2% |
| Canadians | 0.5 /100 | #267 | Tragic 64.1% |
| Spaniards | 0.5 /100 | #268 | Tragic 64.1% |
| Irish | 0.4 /100 | #269 | Tragic 64.1% |
| Guyanese | 0.4 /100 | #270 | Tragic 64.1% |
| Dominicans | 0.4 /100 | #271 | Tragic 64.1% |
| Native Hawaiians | 0.3 /100 | #272 | Tragic 64.1% |
| Hmong | 0.3 /100 | #273 | Tragic 64.1% |
| Immigrants | Cuba | 0.3 /100 | #274 | Tragic 64.1% |
| Mexicans | 0.3 /100 | #275 | Tragic 64.1% |
| French American Indians | 0.3 /100 | #276 | Tragic 64.1% |
| Immigrants | Bahamas | 0.3 /100 | #277 | Tragic 64.0% |