Cree vs Immigrants from Jamaica In Labor Force | Age 16-19
COMPARE
Cree
Immigrants from Jamaica
In Labor Force | Age 16-19
In Labor Force | Age 16-19 Comparison
Cree
Immigrants from Jamaica
40.8%
IN LABOR FORCE | AGE 16-19
100.0/ 100
METRIC RATING
49th/ 347
METRIC RANK
32.2%
IN LABOR FORCE | AGE 16-19
0.0/ 100
METRIC RATING
307th/ 347
METRIC RANK
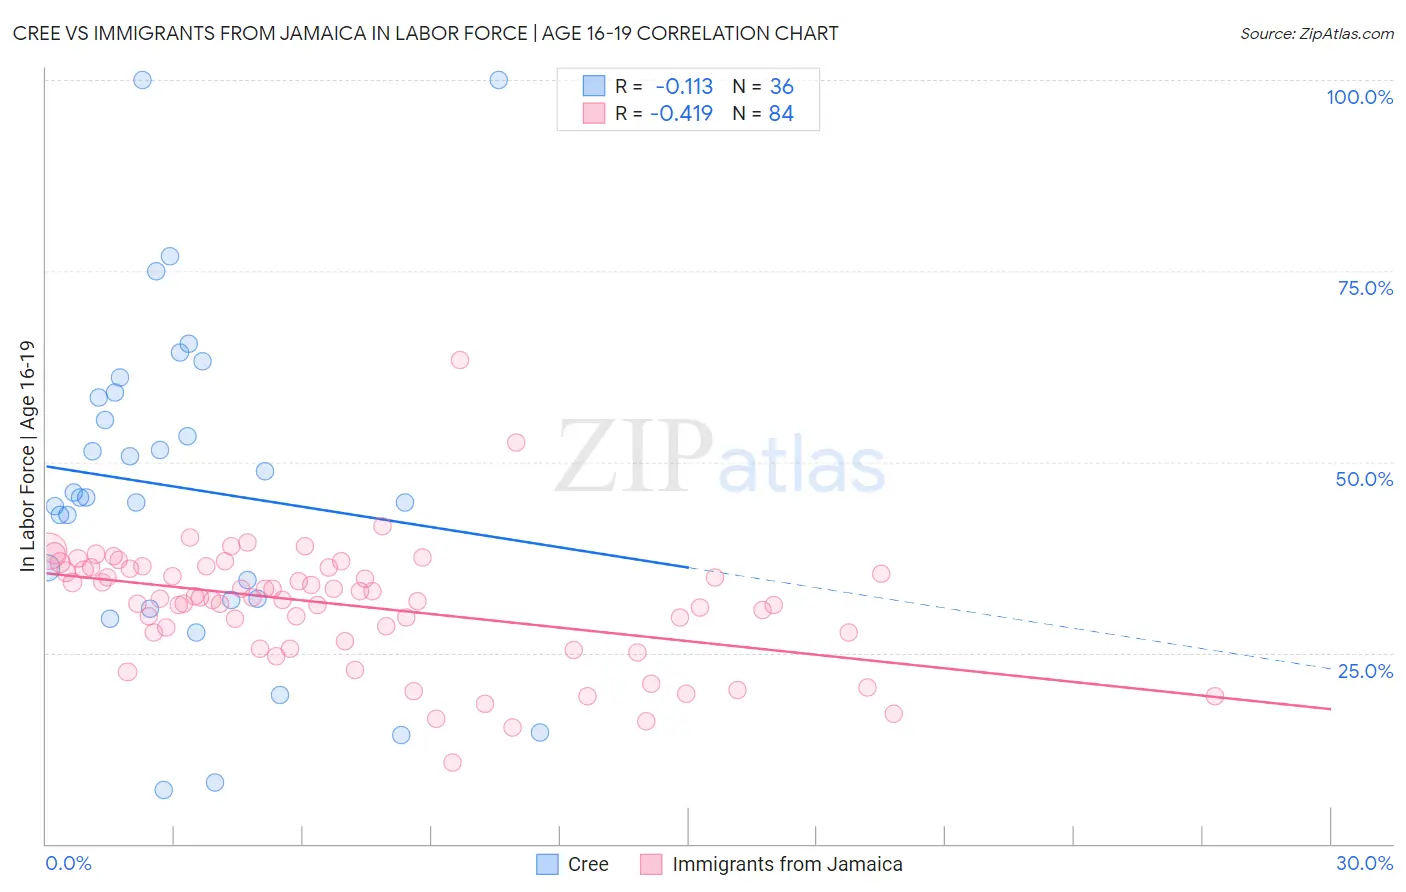
Cree vs Immigrants from Jamaica In Labor Force | Age 16-19 Correlation Chart
The statistical analysis conducted on geographies consisting of 76,173,738 people shows a poor negative correlation between the proportion of Cree and labor force participation rate among population between the ages 16 and 19 in the United States with a correlation coefficient (R) of -0.113 and weighted average of 40.8%. Similarly, the statistical analysis conducted on geographies consisting of 301,478,139 people shows a moderate negative correlation between the proportion of Immigrants from Jamaica and labor force participation rate among population between the ages 16 and 19 in the United States with a correlation coefficient (R) of -0.419 and weighted average of 32.2%, a difference of 26.6%.
In Labor Force | Age 16-19 Correlation Summary
| Measurement | Cree | Immigrants from Jamaica |
| Minimum | 7.1% | 10.6% |
| Maximum | 100.0% | 63.3% |
| Range | 92.9% | 52.7% |
| Mean | 46.6% | 31.2% |
| Median | 45.4% | 32.2% |
| Interquartile 25% (IQ1) | 32.0% | 27.0% |
| Interquartile 75% (IQ3) | 58.8% | 36.1% |
| Interquartile Range (IQR) | 26.8% | 9.0% |
| Standard Deviation (Sample) | 21.8% | 8.0% |
| Standard Deviation (Population) | 21.4% | 8.0% |
Similar Demographics by In Labor Force | Age 16-19
Demographics Similar to Cree by In Labor Force | Age 16-19
In terms of in labor force | age 16-19, the demographic groups most similar to Cree are Icelander (40.8%, a difference of 0.020%), Carpatho Rusyn (40.8%, a difference of 0.070%), Indonesian (40.7%, a difference of 0.16%), Immigrants from Zaire (40.7%, a difference of 0.26%), and Immigrants from Laos (40.6%, a difference of 0.34%).
| Demographics | Rating | Rank | In Labor Force | Age 16-19 |
| Whites/Caucasians | 100.0 /100 | #42 | Exceptional 41.3% |
| Tongans | 100.0 /100 | #43 | Exceptional 41.2% |
| Europeans | 100.0 /100 | #44 | Exceptional 41.1% |
| Croatians | 100.0 /100 | #45 | Exceptional 41.1% |
| Immigrants | Sudan | 100.0 /100 | #46 | Exceptional 41.0% |
| Carpatho Rusyns | 100.0 /100 | #47 | Exceptional 40.8% |
| Icelanders | 100.0 /100 | #48 | Exceptional 40.8% |
| Cree | 100.0 /100 | #49 | Exceptional 40.8% |
| Indonesians | 100.0 /100 | #50 | Exceptional 40.7% |
| Immigrants | Zaire | 100.0 /100 | #51 | Exceptional 40.7% |
| Immigrants | Laos | 100.0 /100 | #52 | Exceptional 40.6% |
| Immigrants | Kenya | 100.0 /100 | #53 | Exceptional 40.5% |
| Tlingit-Haida | 100.0 /100 | #54 | Exceptional 40.5% |
| British | 100.0 /100 | #55 | Exceptional 40.5% |
| Fijians | 100.0 /100 | #56 | Exceptional 40.4% |
Demographics Similar to Immigrants from Jamaica by In Labor Force | Age 16-19
In terms of in labor force | age 16-19, the demographic groups most similar to Immigrants from Jamaica are Navajo (32.1%, a difference of 0.35%), Spanish American Indian (32.4%, a difference of 0.49%), Immigrants from Eastern Asia (32.0%, a difference of 0.53%), Nicaraguan (32.4%, a difference of 0.62%), and Israeli (32.4%, a difference of 0.67%).
| Demographics | Rating | Rank | In Labor Force | Age 16-19 |
| Immigrants | Argentina | 0.0 /100 | #300 | Tragic 32.9% |
| Okinawans | 0.0 /100 | #301 | Tragic 32.8% |
| Belizeans | 0.0 /100 | #302 | Tragic 32.8% |
| Immigrants | Dominica | 0.0 /100 | #303 | Tragic 32.5% |
| Israelis | 0.0 /100 | #304 | Tragic 32.4% |
| Nicaraguans | 0.0 /100 | #305 | Tragic 32.4% |
| Spanish American Indians | 0.0 /100 | #306 | Tragic 32.4% |
| Immigrants | Jamaica | 0.0 /100 | #307 | Tragic 32.2% |
| Navajo | 0.0 /100 | #308 | Tragic 32.1% |
| Immigrants | Eastern Asia | 0.0 /100 | #309 | Tragic 32.0% |
| Immigrants | Iran | 0.0 /100 | #310 | Tragic 32.0% |
| Indians (Asian) | 0.0 /100 | #311 | Tragic 31.9% |
| Immigrants | Belize | 0.0 /100 | #312 | Tragic 31.8% |
| Hopi | 0.0 /100 | #313 | Tragic 31.8% |
| Cubans | 0.0 /100 | #314 | Tragic 31.8% |