Immigrants from Ghana vs Immigrants from Jamaica In Labor Force | Age 16-19
COMPARE
Immigrants from Ghana
Immigrants from Jamaica
In Labor Force | Age 16-19
In Labor Force | Age 16-19 Comparison
Immigrants from Ghana
Immigrants from Jamaica
35.4%
IN LABOR FORCE | AGE 16-19
7.3/ 100
METRIC RATING
222nd/ 347
METRIC RANK
32.2%
IN LABOR FORCE | AGE 16-19
0.0/ 100
METRIC RATING
307th/ 347
METRIC RANK
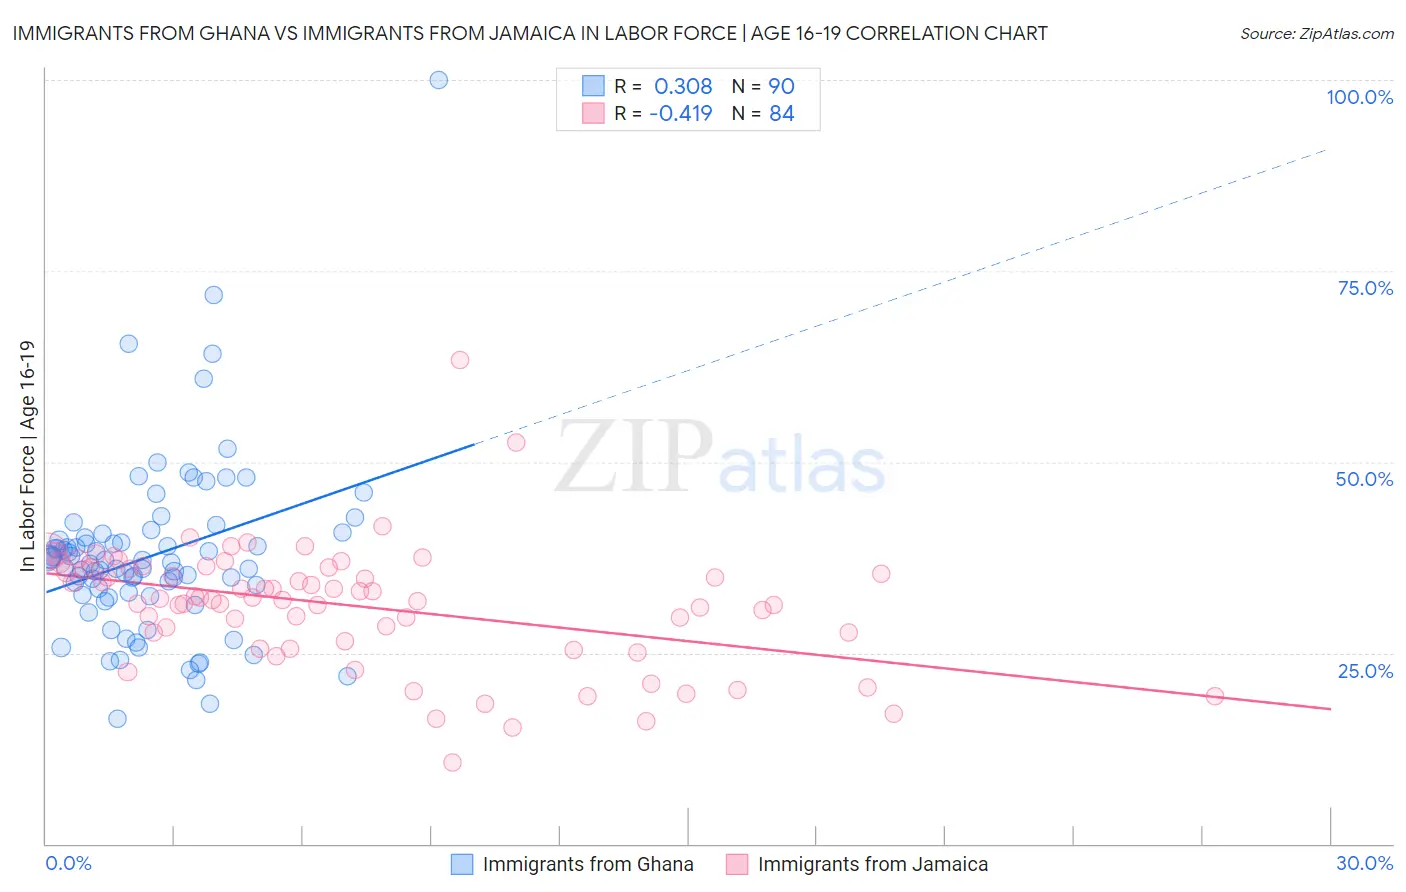
Immigrants from Ghana vs Immigrants from Jamaica In Labor Force | Age 16-19 Correlation Chart
The statistical analysis conducted on geographies consisting of 199,826,706 people shows a mild positive correlation between the proportion of Immigrants from Ghana and labor force participation rate among population between the ages 16 and 19 in the United States with a correlation coefficient (R) of 0.308 and weighted average of 35.4%. Similarly, the statistical analysis conducted on geographies consisting of 301,478,139 people shows a moderate negative correlation between the proportion of Immigrants from Jamaica and labor force participation rate among population between the ages 16 and 19 in the United States with a correlation coefficient (R) of -0.419 and weighted average of 32.2%, a difference of 10.0%.
In Labor Force | Age 16-19 Correlation Summary
| Measurement | Immigrants from Ghana | Immigrants from Jamaica |
| Minimum | 16.3% | 10.6% |
| Maximum | 100.0% | 63.3% |
| Range | 83.7% | 52.7% |
| Mean | 37.7% | 31.2% |
| Median | 36.7% | 32.2% |
| Interquartile 25% (IQ1) | 32.5% | 27.0% |
| Interquartile 75% (IQ3) | 40.1% | 36.1% |
| Interquartile Range (IQR) | 7.5% | 9.0% |
| Standard Deviation (Sample) | 11.6% | 8.0% |
| Standard Deviation (Population) | 11.6% | 8.0% |
Similar Demographics by In Labor Force | Age 16-19
Demographics Similar to Immigrants from Ghana by In Labor Force | Age 16-19
In terms of in labor force | age 16-19, the demographic groups most similar to Immigrants from Ghana are Turkish (35.4%, a difference of 0.010%), Ghanaian (35.3%, a difference of 0.15%), Honduran (35.3%, a difference of 0.16%), Immigrants from Bahamas (35.5%, a difference of 0.19%), and Guatemalan (35.5%, a difference of 0.24%).
| Demographics | Rating | Rank | In Labor Force | Age 16-19 |
| Immigrants | South Eastern Asia | 10.8 /100 | #215 | Poor 35.6% |
| Dutch West Indians | 10.7 /100 | #216 | Poor 35.6% |
| Immigrants | Costa Rica | 10.7 /100 | #217 | Poor 35.6% |
| Sri Lankans | 9.8 /100 | #218 | Tragic 35.5% |
| Guatemalans | 8.6 /100 | #219 | Tragic 35.5% |
| Immigrants | Bahamas | 8.3 /100 | #220 | Tragic 35.5% |
| Turks | 7.3 /100 | #221 | Tragic 35.4% |
| Immigrants | Ghana | 7.3 /100 | #222 | Tragic 35.4% |
| Ghanaians | 6.5 /100 | #223 | Tragic 35.3% |
| Hondurans | 6.5 /100 | #224 | Tragic 35.3% |
| Immigrants | Belgium | 6.1 /100 | #225 | Tragic 35.3% |
| Immigrants | Guatemala | 5.7 /100 | #226 | Tragic 35.3% |
| Mongolians | 5.7 /100 | #227 | Tragic 35.3% |
| Immigrants | Senegal | 5.5 /100 | #228 | Tragic 35.3% |
| Immigrants | Lebanon | 5.0 /100 | #229 | Tragic 35.2% |
Demographics Similar to Immigrants from Jamaica by In Labor Force | Age 16-19
In terms of in labor force | age 16-19, the demographic groups most similar to Immigrants from Jamaica are Navajo (32.1%, a difference of 0.35%), Spanish American Indian (32.4%, a difference of 0.49%), Immigrants from Eastern Asia (32.0%, a difference of 0.53%), Nicaraguan (32.4%, a difference of 0.62%), and Israeli (32.4%, a difference of 0.67%).
| Demographics | Rating | Rank | In Labor Force | Age 16-19 |
| Immigrants | Argentina | 0.0 /100 | #300 | Tragic 32.9% |
| Okinawans | 0.0 /100 | #301 | Tragic 32.8% |
| Belizeans | 0.0 /100 | #302 | Tragic 32.8% |
| Immigrants | Dominica | 0.0 /100 | #303 | Tragic 32.5% |
| Israelis | 0.0 /100 | #304 | Tragic 32.4% |
| Nicaraguans | 0.0 /100 | #305 | Tragic 32.4% |
| Spanish American Indians | 0.0 /100 | #306 | Tragic 32.4% |
| Immigrants | Jamaica | 0.0 /100 | #307 | Tragic 32.2% |
| Navajo | 0.0 /100 | #308 | Tragic 32.1% |
| Immigrants | Eastern Asia | 0.0 /100 | #309 | Tragic 32.0% |
| Immigrants | Iran | 0.0 /100 | #310 | Tragic 32.0% |
| Indians (Asian) | 0.0 /100 | #311 | Tragic 31.9% |
| Immigrants | Belize | 0.0 /100 | #312 | Tragic 31.8% |
| Hopi | 0.0 /100 | #313 | Tragic 31.8% |
| Cubans | 0.0 /100 | #314 | Tragic 31.8% |