Osage vs Immigrants from Jamaica Unemployment Among Women with Children Ages 6 to 17 years
COMPARE
Osage
Immigrants from Jamaica
Unemployment Among Women with Children Ages 6 to 17 years
Unemployment Among Women with Children Ages 6 to 17 years Comparison
Osage
Immigrants from Jamaica
8.9%
UNEMPLOYMENT AMONG WOMEN WITH CHILDREN AGES 6 TO 17 YEARS
65.9/ 100
METRIC RATING
156th/ 347
METRIC RANK
9.5%
UNEMPLOYMENT AMONG WOMEN WITH CHILDREN AGES 6 TO 17 YEARS
0.3/ 100
METRIC RATING
266th/ 347
METRIC RANK
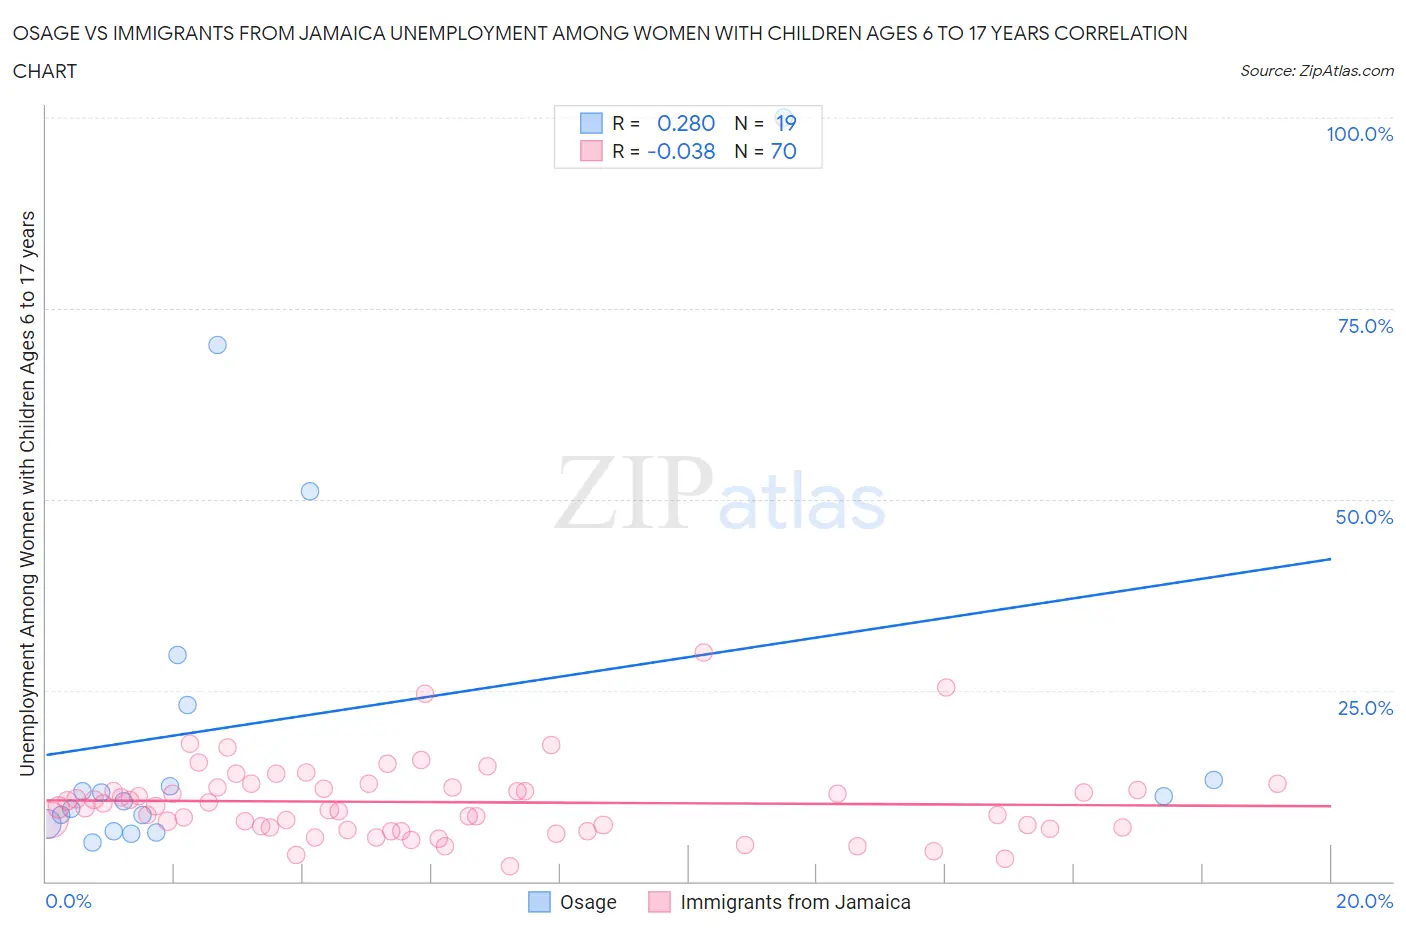
Osage vs Immigrants from Jamaica Unemployment Among Women with Children Ages 6 to 17 years Correlation Chart
The statistical analysis conducted on geographies consisting of 80,640,206 people shows a weak positive correlation between the proportion of Osage and unemployment rate among women with children between the ages 6 and 17 in the United States with a correlation coefficient (R) of 0.280 and weighted average of 8.9%. Similarly, the statistical analysis conducted on geographies consisting of 232,133,917 people shows no correlation between the proportion of Immigrants from Jamaica and unemployment rate among women with children between the ages 6 and 17 in the United States with a correlation coefficient (R) of -0.038 and weighted average of 9.5%, a difference of 7.2%.
Unemployment Among Women with Children Ages 6 to 17 years Correlation Summary
| Measurement | Osage | Immigrants from Jamaica |
| Minimum | 5.1% | 1.9% |
| Maximum | 100.0% | 30.0% |
| Range | 94.9% | 28.1% |
| Mean | 21.2% | 10.4% |
| Median | 11.1% | 9.8% |
| Interquartile 25% (IQ1) | 7.5% | 7.0% |
| Interquartile 75% (IQ3) | 23.0% | 12.2% |
| Interquartile Range (IQR) | 15.5% | 5.3% |
| Standard Deviation (Sample) | 25.5% | 5.0% |
| Standard Deviation (Population) | 24.8% | 5.0% |
Similar Demographics by Unemployment Among Women with Children Ages 6 to 17 years
Demographics Similar to Osage by Unemployment Among Women with Children Ages 6 to 17 years
In terms of unemployment among women with children ages 6 to 17 years, the demographic groups most similar to Osage are Immigrants from Belgium (8.9%, a difference of 0.010%), Immigrants from Chile (8.9%, a difference of 0.030%), Spanish (8.9%, a difference of 0.10%), Immigrants from Hungary (8.9%, a difference of 0.12%), and Immigrants from Guyana (8.9%, a difference of 0.15%).
| Demographics | Rating | Rank | Unemployment Among Women with Children Ages 6 to 17 years |
| Croatians | 76.0 /100 | #149 | Good 8.8% |
| Greeks | 75.2 /100 | #150 | Good 8.9% |
| Immigrants | Eastern Africa | 74.6 /100 | #151 | Good 8.9% |
| Immigrants | Northern Europe | 74.6 /100 | #152 | Good 8.9% |
| Immigrants | Europe | 73.4 /100 | #153 | Good 8.9% |
| Vietnamese | 72.1 /100 | #154 | Good 8.9% |
| Immigrants | Greece | 71.8 /100 | #155 | Good 8.9% |
| Osage | 65.9 /100 | #156 | Good 8.9% |
| Immigrants | Belgium | 65.6 /100 | #157 | Good 8.9% |
| Immigrants | Chile | 65.3 /100 | #158 | Good 8.9% |
| Spanish | 63.8 /100 | #159 | Good 8.9% |
| Immigrants | Hungary | 63.4 /100 | #160 | Good 8.9% |
| Immigrants | Guyana | 63.0 /100 | #161 | Good 8.9% |
| Immigrants | Netherlands | 60.8 /100 | #162 | Good 8.9% |
| Mexican American Indians | 60.6 /100 | #163 | Good 8.9% |
Demographics Similar to Immigrants from Jamaica by Unemployment Among Women with Children Ages 6 to 17 years
In terms of unemployment among women with children ages 6 to 17 years, the demographic groups most similar to Immigrants from Jamaica are Irish (9.5%, a difference of 0.020%), West Indian (9.5%, a difference of 0.16%), Immigrants from Ghana (9.5%, a difference of 0.20%), Ghanaian (9.6%, a difference of 0.41%), and Lebanese (9.5%, a difference of 0.44%).
| Demographics | Rating | Rank | Unemployment Among Women with Children Ages 6 to 17 years |
| Immigrants | Central America | 0.6 /100 | #259 | Tragic 9.5% |
| Italians | 0.6 /100 | #260 | Tragic 9.5% |
| South Americans | 0.5 /100 | #261 | Tragic 9.5% |
| Senegalese | 0.5 /100 | #262 | Tragic 9.5% |
| Lebanese | 0.5 /100 | #263 | Tragic 9.5% |
| Immigrants | Ghana | 0.4 /100 | #264 | Tragic 9.5% |
| West Indians | 0.4 /100 | #265 | Tragic 9.5% |
| Immigrants | Jamaica | 0.3 /100 | #266 | Tragic 9.5% |
| Irish | 0.3 /100 | #267 | Tragic 9.5% |
| Ghanaians | 0.2 /100 | #268 | Tragic 9.6% |
| Blackfeet | 0.2 /100 | #269 | Tragic 9.6% |
| Immigrants | Nicaragua | 0.2 /100 | #270 | Tragic 9.6% |
| Immigrants | Latin America | 0.1 /100 | #271 | Tragic 9.6% |
| Kiowa | 0.1 /100 | #272 | Tragic 9.6% |
| Whites/Caucasians | 0.1 /100 | #273 | Tragic 9.6% |