Pima vs Immigrants from Romania In Labor Force | Age > 16
COMPARE
Pima
Immigrants from Romania
In Labor Force | Age > 16
In Labor Force | Age > 16 Comparison
Pima
Immigrants from Romania
57.4%
IN LABOR FORCE | AGE > 16
0.0/ 100
METRIC RATING
344th/ 347
METRIC RANK
65.5%
IN LABOR FORCE | AGE > 16
88.6/ 100
METRIC RATING
144th/ 347
METRIC RANK
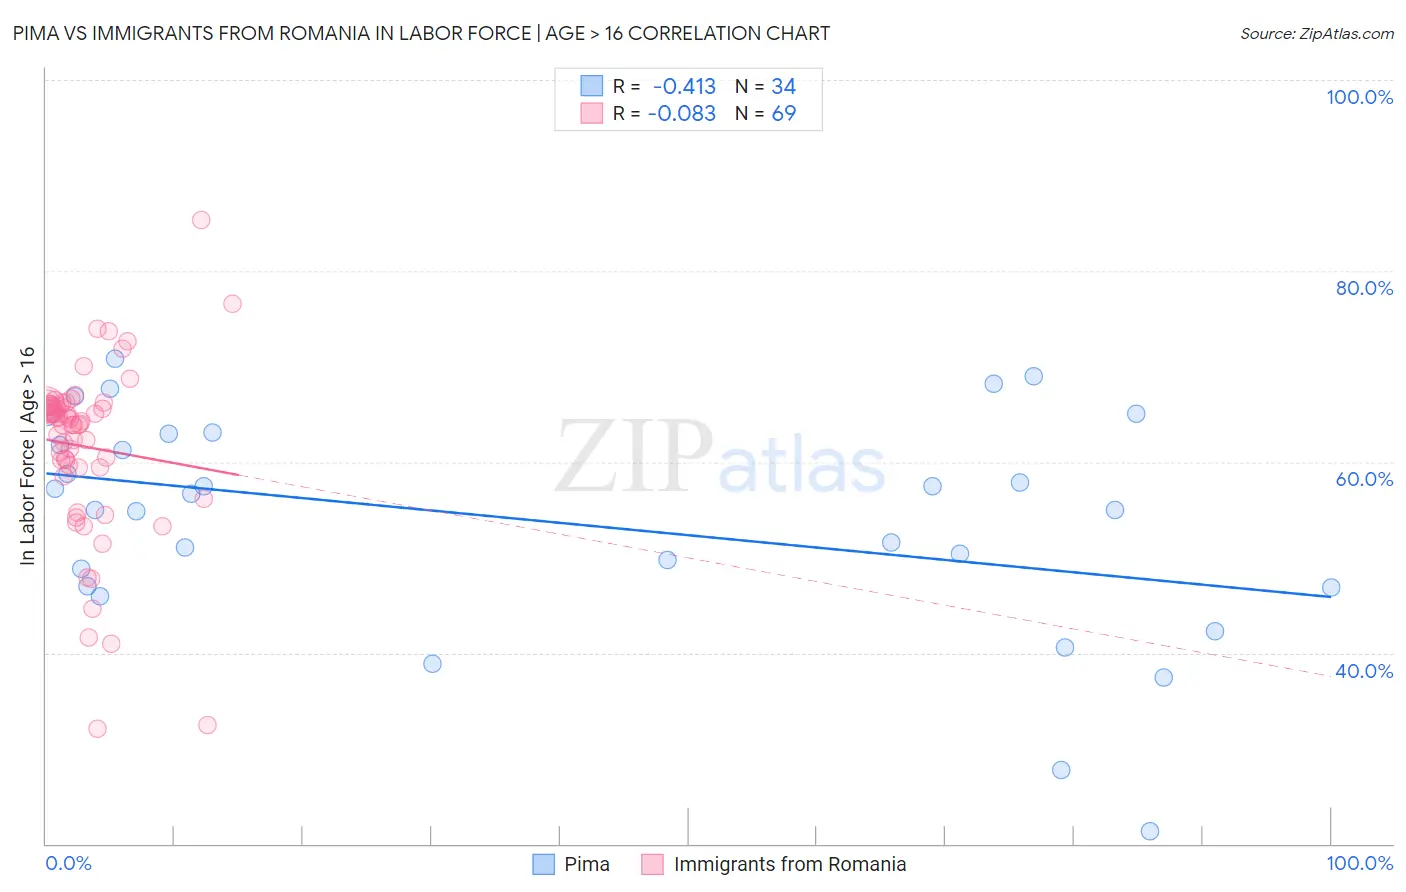
Pima vs Immigrants from Romania In Labor Force | Age > 16 Correlation Chart
The statistical analysis conducted on geographies consisting of 61,542,645 people shows a moderate negative correlation between the proportion of Pima and labor force participation rate among population ages 16 and over in the United States with a correlation coefficient (R) of -0.413 and weighted average of 57.4%. Similarly, the statistical analysis conducted on geographies consisting of 257,014,238 people shows a slight negative correlation between the proportion of Immigrants from Romania and labor force participation rate among population ages 16 and over in the United States with a correlation coefficient (R) of -0.083 and weighted average of 65.5%, a difference of 14.1%.
In Labor Force | Age > 16 Correlation Summary
| Measurement | Pima | Immigrants from Romania |
| Minimum | 21.3% | 32.1% |
| Maximum | 70.8% | 85.3% |
| Range | 49.5% | 53.2% |
| Mean | 53.8% | 61.6% |
| Median | 55.8% | 64.3% |
| Interquartile 25% (IQ1) | 46.9% | 59.4% |
| Interquartile 75% (IQ3) | 62.9% | 66.0% |
| Interquartile Range (IQR) | 16.0% | 6.6% |
| Standard Deviation (Sample) | 11.6% | 9.1% |
| Standard Deviation (Population) | 11.5% | 9.0% |
Similar Demographics by In Labor Force | Age > 16
Demographics Similar to Pima by In Labor Force | Age > 16
In terms of in labor force | age > 16, the demographic groups most similar to Pima are Tohono O'odham (57.2%, a difference of 0.29%), Yuman (57.8%, a difference of 0.70%), Lumbee (56.8%, a difference of 1.1%), Puerto Rican (58.1%, a difference of 1.2%), and Navajo (56.6%, a difference of 1.5%).
| Demographics | Rating | Rank | In Labor Force | Age > 16 |
| Paiute | 0.0 /100 | #333 | Tragic 60.7% |
| Apache | 0.0 /100 | #334 | Tragic 60.7% |
| Natives/Alaskans | 0.0 /100 | #335 | Tragic 60.6% |
| Menominee | 0.0 /100 | #336 | Tragic 60.6% |
| Colville | 0.0 /100 | #337 | Tragic 59.8% |
| Immigrants | Yemen | 0.0 /100 | #338 | Tragic 59.6% |
| Houma | 0.0 /100 | #339 | Tragic 59.5% |
| Pueblo | 0.0 /100 | #340 | Tragic 59.3% |
| Hopi | 0.0 /100 | #341 | Tragic 58.4% |
| Puerto Ricans | 0.0 /100 | #342 | Tragic 58.1% |
| Yuman | 0.0 /100 | #343 | Tragic 57.8% |
| Pima | 0.0 /100 | #344 | Tragic 57.4% |
| Tohono O'odham | 0.0 /100 | #345 | Tragic 57.2% |
| Lumbee | 0.0 /100 | #346 | Tragic 56.8% |
| Navajo | 0.0 /100 | #347 | Tragic 56.6% |
Demographics Similar to Immigrants from Romania by In Labor Force | Age > 16
In terms of in labor force | age > 16, the demographic groups most similar to Immigrants from Romania are Tlingit-Haida (65.5%, a difference of 0.010%), Cypriot (65.5%, a difference of 0.010%), Indian (Asian) (65.5%, a difference of 0.020%), Latvian (65.5%, a difference of 0.020%), and Immigrants from Oceania (65.5%, a difference of 0.030%).
| Demographics | Rating | Rank | In Labor Force | Age > 16 |
| Guamanians/Chamorros | 92.4 /100 | #137 | Exceptional 65.6% |
| Immigrants | West Indies | 92.0 /100 | #138 | Exceptional 65.6% |
| Immigrants | Taiwan | 90.8 /100 | #139 | Exceptional 65.5% |
| Immigrants | Costa Rica | 90.8 /100 | #140 | Exceptional 65.5% |
| Samoans | 90.5 /100 | #141 | Exceptional 65.5% |
| Indians (Asian) | 89.5 /100 | #142 | Excellent 65.5% |
| Latvians | 89.4 /100 | #143 | Excellent 65.5% |
| Immigrants | Romania | 88.6 /100 | #144 | Excellent 65.5% |
| Tlingit-Haida | 88.3 /100 | #145 | Excellent 65.5% |
| Cypriots | 88.2 /100 | #146 | Excellent 65.5% |
| Immigrants | Oceania | 87.5 /100 | #147 | Excellent 65.5% |
| Bhutanese | 86.3 /100 | #148 | Excellent 65.5% |
| Immigrants | Albania | 85.7 /100 | #149 | Excellent 65.4% |
| Immigrants | Immigrants | 81.9 /100 | #150 | Excellent 65.4% |
| Czechs | 81.5 /100 | #151 | Excellent 65.4% |