Norwegian vs Immigrants from Nepal 6th Grade
COMPARE
Norwegian
Immigrants from Nepal
6th Grade
6th Grade Comparison
Norwegians
Immigrants from Nepal
98.3%
6TH GRADE
100.0/ 100
METRIC RATING
6th/ 347
METRIC RANK
96.8%
6TH GRADE
10.1/ 100
METRIC RATING
210th/ 347
METRIC RANK
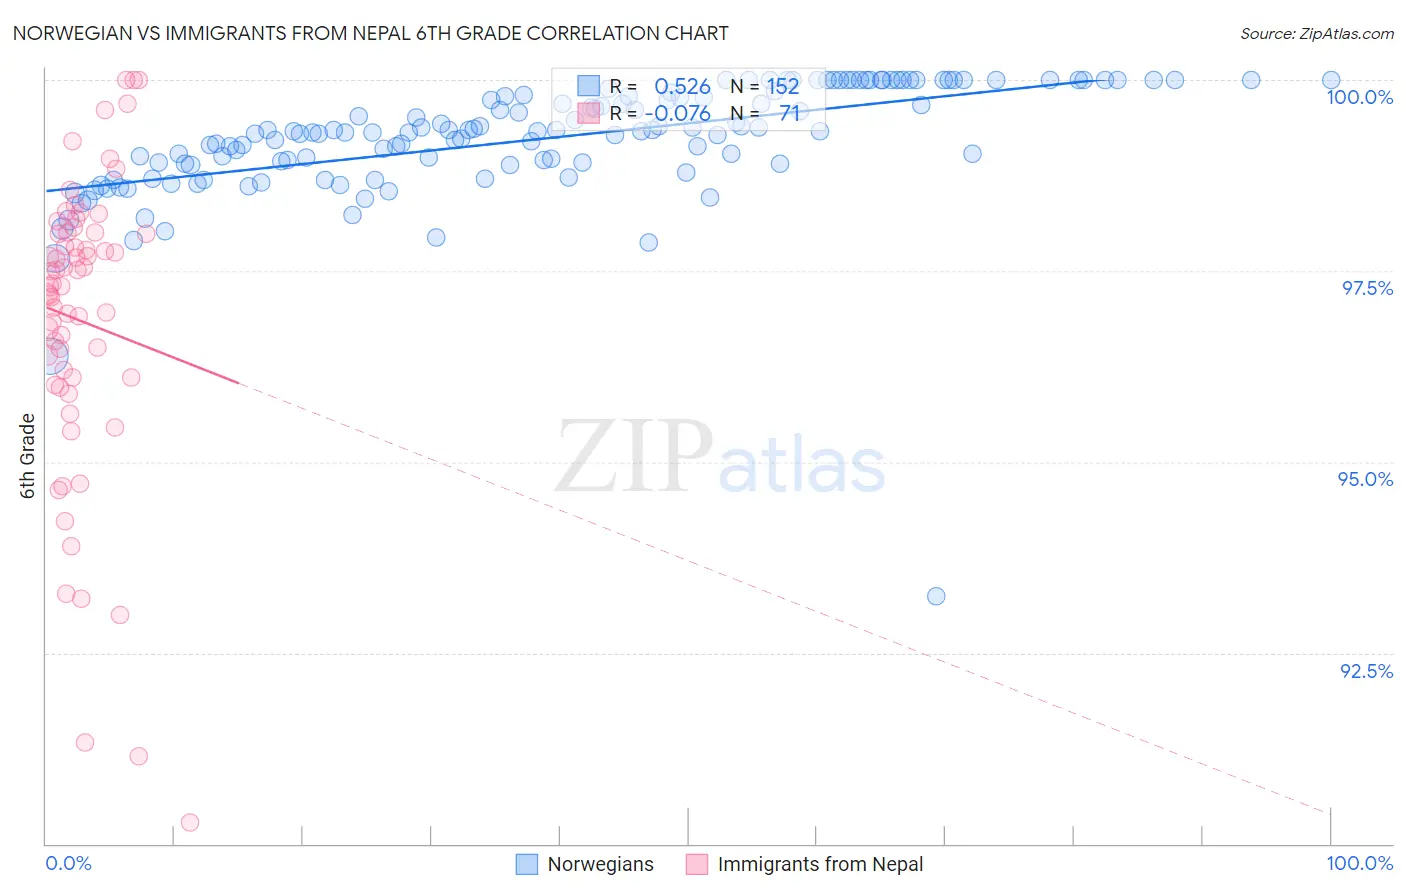
Norwegian vs Immigrants from Nepal 6th Grade Correlation Chart
The statistical analysis conducted on geographies consisting of 533,395,488 people shows a substantial positive correlation between the proportion of Norwegians and percentage of population with at least 6th grade education in the United States with a correlation coefficient (R) of 0.526 and weighted average of 98.3%. Similarly, the statistical analysis conducted on geographies consisting of 186,739,570 people shows a slight negative correlation between the proportion of Immigrants from Nepal and percentage of population with at least 6th grade education in the United States with a correlation coefficient (R) of -0.076 and weighted average of 96.8%, a difference of 1.5%.
6th Grade Correlation Summary
| Measurement | Norwegian | Immigrants from Nepal |
| Minimum | 93.2% | 90.3% |
| Maximum | 100.0% | 100.0% |
| Range | 6.8% | 9.7% |
| Mean | 99.2% | 96.8% |
| Median | 99.3% | 97.3% |
| Interquartile 25% (IQ1) | 98.9% | 96.1% |
| Interquartile 75% (IQ3) | 99.8% | 98.0% |
| Interquartile Range (IQR) | 0.92% | 1.9% |
| Standard Deviation (Sample) | 0.79% | 2.0% |
| Standard Deviation (Population) | 0.79% | 2.0% |
Similar Demographics by 6th Grade
Demographics Similar to Norwegians by 6th Grade
In terms of 6th grade, the demographic groups most similar to Norwegians are Tsimshian (98.3%, a difference of 0.0%), German (98.2%, a difference of 0.040%), Slovak (98.2%, a difference of 0.040%), Dutch (98.4%, a difference of 0.070%), and Slovene (98.2%, a difference of 0.10%).
| Demographics | Rating | Rank | 6th Grade |
| Crow | 100.0 /100 | #1 | Exceptional 99.4% |
| Ottawa | 100.0 /100 | #2 | Exceptional 98.5% |
| Welsh | 100.0 /100 | #3 | Exceptional 98.5% |
| Dutch | 100.0 /100 | #4 | Exceptional 98.4% |
| Tsimshian | 100.0 /100 | #5 | Exceptional 98.3% |
| Norwegians | 100.0 /100 | #6 | Exceptional 98.3% |
| Germans | 100.0 /100 | #7 | Exceptional 98.2% |
| Slovaks | 100.0 /100 | #8 | Exceptional 98.2% |
| Slovenes | 100.0 /100 | #9 | Exceptional 98.2% |
| Swedes | 100.0 /100 | #10 | Exceptional 98.2% |
| English | 100.0 /100 | #11 | Exceptional 98.1% |
| Alaskan Athabascans | 100.0 /100 | #12 | Exceptional 98.1% |
| Tlingit-Haida | 100.0 /100 | #13 | Exceptional 98.1% |
| Carpatho Rusyns | 100.0 /100 | #14 | Exceptional 98.1% |
| Inupiat | 100.0 /100 | #15 | Exceptional 98.1% |
Demographics Similar to Immigrants from Nepal by 6th Grade
In terms of 6th grade, the demographic groups most similar to Immigrants from Nepal are Samoan (96.8%, a difference of 0.010%), Immigrants from Oceania (96.8%, a difference of 0.010%), Immigrants from Iraq (96.8%, a difference of 0.010%), Laotian (96.8%, a difference of 0.020%), and Iraqi (96.8%, a difference of 0.020%).
| Demographics | Rating | Rank | 6th Grade |
| Sudanese | 13.9 /100 | #203 | Poor 96.8% |
| Immigrants | Bahamas | 13.8 /100 | #204 | Poor 96.8% |
| Natives/Alaskans | 13.0 /100 | #205 | Poor 96.8% |
| Laotians | 11.8 /100 | #206 | Poor 96.8% |
| Iraqis | 11.7 /100 | #207 | Poor 96.8% |
| Samoans | 11.0 /100 | #208 | Poor 96.8% |
| Immigrants | Oceania | 11.0 /100 | #209 | Poor 96.8% |
| Immigrants | Nepal | 10.1 /100 | #210 | Poor 96.8% |
| Immigrants | Iraq | 9.2 /100 | #211 | Tragic 96.8% |
| Moroccans | 9.0 /100 | #212 | Tragic 96.8% |
| Immigrants | Sudan | 8.7 /100 | #213 | Tragic 96.8% |
| Portuguese | 8.2 /100 | #214 | Tragic 96.8% |
| Sierra Leoneans | 8.0 /100 | #215 | Tragic 96.8% |
| Paiute | 7.8 /100 | #216 | Tragic 96.8% |
| Liberians | 7.5 /100 | #217 | Tragic 96.8% |