Nonimmigrants vs Immigrants from Honduras In Labor Force | Age 16-19
COMPARE
Nonimmigrants
Immigrants from Honduras
In Labor Force | Age 16-19
In Labor Force | Age 16-19 Comparison
Nonimmigrants
Immigrants from Honduras
40.1%
IN LABOR FORCE | AGE 16-19
100.0/ 100
METRIC RATING
66th/ 347
METRIC RANK
35.2%
IN LABOR FORCE | AGE 16-19
4.9/ 100
METRIC RATING
230th/ 347
METRIC RANK
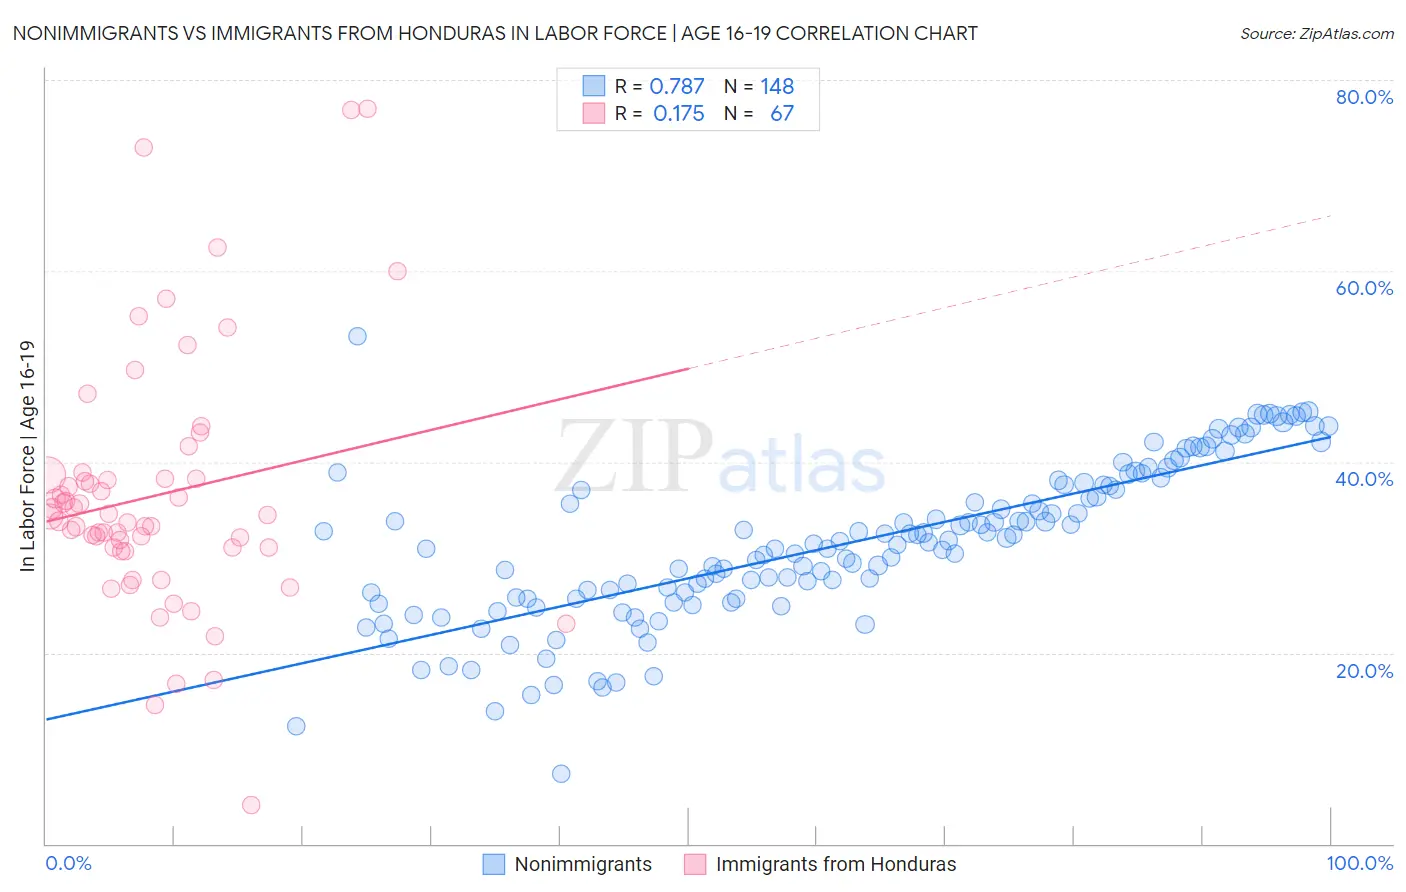
Nonimmigrants vs Immigrants from Honduras In Labor Force | Age 16-19 Correlation Chart
The statistical analysis conducted on geographies consisting of 578,466,762 people shows a strong positive correlation between the proportion of Nonimmigrants and labor force participation rate among population between the ages 16 and 19 in the United States with a correlation coefficient (R) of 0.787 and weighted average of 40.1%. Similarly, the statistical analysis conducted on geographies consisting of 322,269,112 people shows a poor positive correlation between the proportion of Immigrants from Honduras and labor force participation rate among population between the ages 16 and 19 in the United States with a correlation coefficient (R) of 0.175 and weighted average of 35.2%, a difference of 13.9%.
In Labor Force | Age 16-19 Correlation Summary
| Measurement | Nonimmigrants | Immigrants from Honduras |
| Minimum | 7.3% | 4.1% |
| Maximum | 53.1% | 77.0% |
| Range | 45.8% | 72.9% |
| Mean | 31.6% | 36.5% |
| Median | 31.6% | 34.3% |
| Interquartile 25% (IQ1) | 25.8% | 31.0% |
| Interquartile 75% (IQ3) | 37.7% | 38.2% |
| Interquartile Range (IQR) | 12.0% | 7.2% |
| Standard Deviation (Sample) | 8.3% | 13.2% |
| Standard Deviation (Population) | 8.3% | 13.1% |
Similar Demographics by In Labor Force | Age 16-19
Demographics Similar to Nonimmigrants by In Labor Force | Age 16-19
In terms of in labor force | age 16-19, the demographic groups most similar to Nonimmigrants are Canadian (40.1%, a difference of 0.010%), Italian (40.1%, a difference of 0.070%), Kenyan (40.1%, a difference of 0.12%), Potawatomi (40.0%, a difference of 0.14%), and Portuguese (40.0%, a difference of 0.19%).
| Demographics | Rating | Rank | In Labor Force | Age 16-19 |
| Slavs | 100.0 /100 | #59 | Exceptional 40.4% |
| Immigrants | Eastern Africa | 100.0 /100 | #60 | Exceptional 40.4% |
| Americans | 100.0 /100 | #61 | Exceptional 40.3% |
| Cherokee | 100.0 /100 | #62 | Exceptional 40.2% |
| Northern Europeans | 100.0 /100 | #63 | Exceptional 40.2% |
| Immigrants | Micronesia | 100.0 /100 | #64 | Exceptional 40.2% |
| Kenyans | 100.0 /100 | #65 | Exceptional 40.1% |
| Immigrants | Nonimmigrants | 100.0 /100 | #66 | Exceptional 40.1% |
| Canadians | 100.0 /100 | #67 | Exceptional 40.1% |
| Italians | 99.9 /100 | #68 | Exceptional 40.1% |
| Potawatomi | 99.9 /100 | #69 | Exceptional 40.0% |
| Portuguese | 99.9 /100 | #70 | Exceptional 40.0% |
| Serbians | 99.9 /100 | #71 | Exceptional 39.9% |
| Iroquois | 99.9 /100 | #72 | Exceptional 39.9% |
| Immigrants | Middle Africa | 99.9 /100 | #73 | Exceptional 39.9% |
Demographics Similar to Immigrants from Honduras by In Labor Force | Age 16-19
In terms of in labor force | age 16-19, the demographic groups most similar to Immigrants from Honduras are Immigrants from Lebanon (35.2%, a difference of 0.030%), Immigrants from Syria (35.2%, a difference of 0.12%), Immigrants from Kazakhstan (35.2%, a difference of 0.12%), Immigrants from Senegal (35.3%, a difference of 0.16%), and Immigrants from France (35.1%, a difference of 0.17%).
| Demographics | Rating | Rank | In Labor Force | Age 16-19 |
| Ghanaians | 6.5 /100 | #223 | Tragic 35.3% |
| Hondurans | 6.5 /100 | #224 | Tragic 35.3% |
| Immigrants | Belgium | 6.1 /100 | #225 | Tragic 35.3% |
| Immigrants | Guatemala | 5.7 /100 | #226 | Tragic 35.3% |
| Mongolians | 5.7 /100 | #227 | Tragic 35.3% |
| Immigrants | Senegal | 5.5 /100 | #228 | Tragic 35.3% |
| Immigrants | Lebanon | 5.0 /100 | #229 | Tragic 35.2% |
| Immigrants | Honduras | 4.9 /100 | #230 | Tragic 35.2% |
| Immigrants | Syria | 4.5 /100 | #231 | Tragic 35.2% |
| Immigrants | Kazakhstan | 4.5 /100 | #232 | Tragic 35.2% |
| Immigrants | France | 4.3 /100 | #233 | Tragic 35.1% |
| Immigrants | Mexico | 4.2 /100 | #234 | Tragic 35.1% |
| Immigrants | Philippines | 4.0 /100 | #235 | Tragic 35.1% |
| Immigrants | Australia | 3.6 /100 | #236 | Tragic 35.1% |
| Immigrants | India | 3.5 /100 | #237 | Tragic 35.0% |