Nonimmigrants vs Central American In Labor Force | Age 25-29
COMPARE
Nonimmigrants
Central American
In Labor Force | Age 25-29
In Labor Force | Age 25-29 Comparison
Nonimmigrants
Central Americans
83.7%
IN LABOR FORCE | AGE 25-29
0.3/ 100
METRIC RATING
248th/ 347
METRIC RANK
83.7%
IN LABOR FORCE | AGE 25-29
0.2/ 100
METRIC RATING
250th/ 347
METRIC RANK
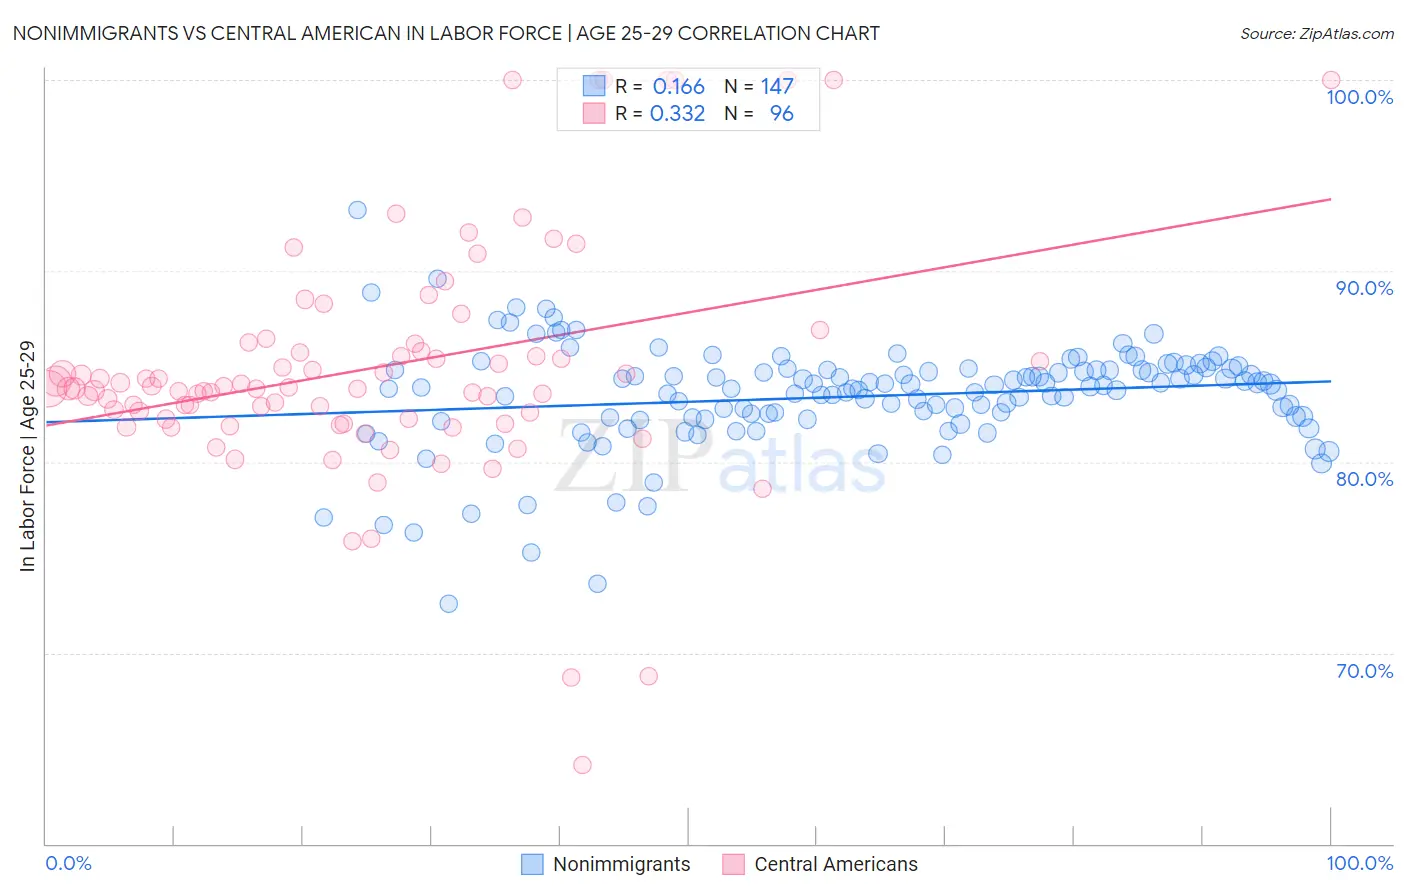
Nonimmigrants vs Central American In Labor Force | Age 25-29 Correlation Chart
The statistical analysis conducted on geographies consisting of 582,659,660 people shows a poor positive correlation between the proportion of Nonimmigrants and labor force participation rate among population between the ages 25 and 29 in the United States with a correlation coefficient (R) of 0.166 and weighted average of 83.7%. Similarly, the statistical analysis conducted on geographies consisting of 504,238,703 people shows a mild positive correlation between the proportion of Central Americans and labor force participation rate among population between the ages 25 and 29 in the United States with a correlation coefficient (R) of 0.332 and weighted average of 83.7%, a difference of 0.030%.
In Labor Force | Age 25-29 Correlation Summary
| Measurement | Nonimmigrants | Central American |
| Minimum | 72.6% | 64.1% |
| Maximum | 93.2% | 100.0% |
| Range | 20.6% | 35.9% |
| Mean | 83.4% | 84.9% |
| Median | 83.9% | 83.8% |
| Interquartile 25% (IQ1) | 82.3% | 82.2% |
| Interquartile 75% (IQ3) | 84.8% | 86.0% |
| Interquartile Range (IQR) | 2.5% | 3.7% |
| Standard Deviation (Sample) | 2.8% | 6.3% |
| Standard Deviation (Population) | 2.8% | 6.3% |
Demographics Similar to Nonimmigrants and Central Americans by In Labor Force | Age 25-29
In terms of in labor force | age 25-29, the demographic groups most similar to Nonimmigrants are Hmong (83.7%, a difference of 0.010%), Immigrants from El Salvador (83.7%, a difference of 0.020%), Cree (83.8%, a difference of 0.030%), Bahamian (83.7%, a difference of 0.040%), and Guatemalan (83.7%, a difference of 0.050%). Similarly, the demographic groups most similar to Central Americans are Hmong (83.7%, a difference of 0.020%), Bahamian (83.7%, a difference of 0.020%), Guatemalan (83.7%, a difference of 0.020%), Immigrants from Trinidad and Tobago (83.7%, a difference of 0.030%), and Spaniard (83.7%, a difference of 0.030%).
| Demographics | Rating | Rank | In Labor Force | Age 25-29 |
| Jamaicans | 0.8 /100 | #239 | Tragic 83.9% |
| Trinidadians and Tobagonians | 0.7 /100 | #240 | Tragic 83.9% |
| Alsatians | 0.7 /100 | #241 | Tragic 83.9% |
| U.S. Virgin Islanders | 0.6 /100 | #242 | Tragic 83.8% |
| Salvadorans | 0.5 /100 | #243 | Tragic 83.8% |
| Immigrants | Jamaica | 0.4 /100 | #244 | Tragic 83.8% |
| Iroquois | 0.4 /100 | #245 | Tragic 83.8% |
| Cree | 0.3 /100 | #246 | Tragic 83.8% |
| Immigrants | El Salvador | 0.3 /100 | #247 | Tragic 83.7% |
| Immigrants | Nonimmigrants | 0.3 /100 | #248 | Tragic 83.7% |
| Hmong | 0.3 /100 | #249 | Tragic 83.7% |
| Central Americans | 0.2 /100 | #250 | Tragic 83.7% |
| Bahamians | 0.2 /100 | #251 | Tragic 83.7% |
| Guatemalans | 0.2 /100 | #252 | Tragic 83.7% |
| Immigrants | Trinidad and Tobago | 0.2 /100 | #253 | Tragic 83.7% |
| Spaniards | 0.2 /100 | #254 | Tragic 83.7% |
| Haitians | 0.2 /100 | #255 | Tragic 83.7% |
| Immigrants | Haiti | 0.2 /100 | #256 | Tragic 83.7% |
| Delaware | 0.2 /100 | #257 | Tragic 83.7% |
| Immigrants | Guatemala | 0.1 /100 | #258 | Tragic 83.6% |
| Spanish | 0.1 /100 | #259 | Tragic 83.6% |