Nonimmigrants vs South American In Labor Force | Age 25-29
COMPARE
Nonimmigrants
South American
In Labor Force | Age 25-29
In Labor Force | Age 25-29 Comparison
Nonimmigrants
South Americans
83.7%
IN LABOR FORCE | AGE 25-29
0.3/ 100
METRIC RATING
248th/ 347
METRIC RANK
84.7%
IN LABOR FORCE | AGE 25-29
54.9/ 100
METRIC RATING
168th/ 347
METRIC RANK
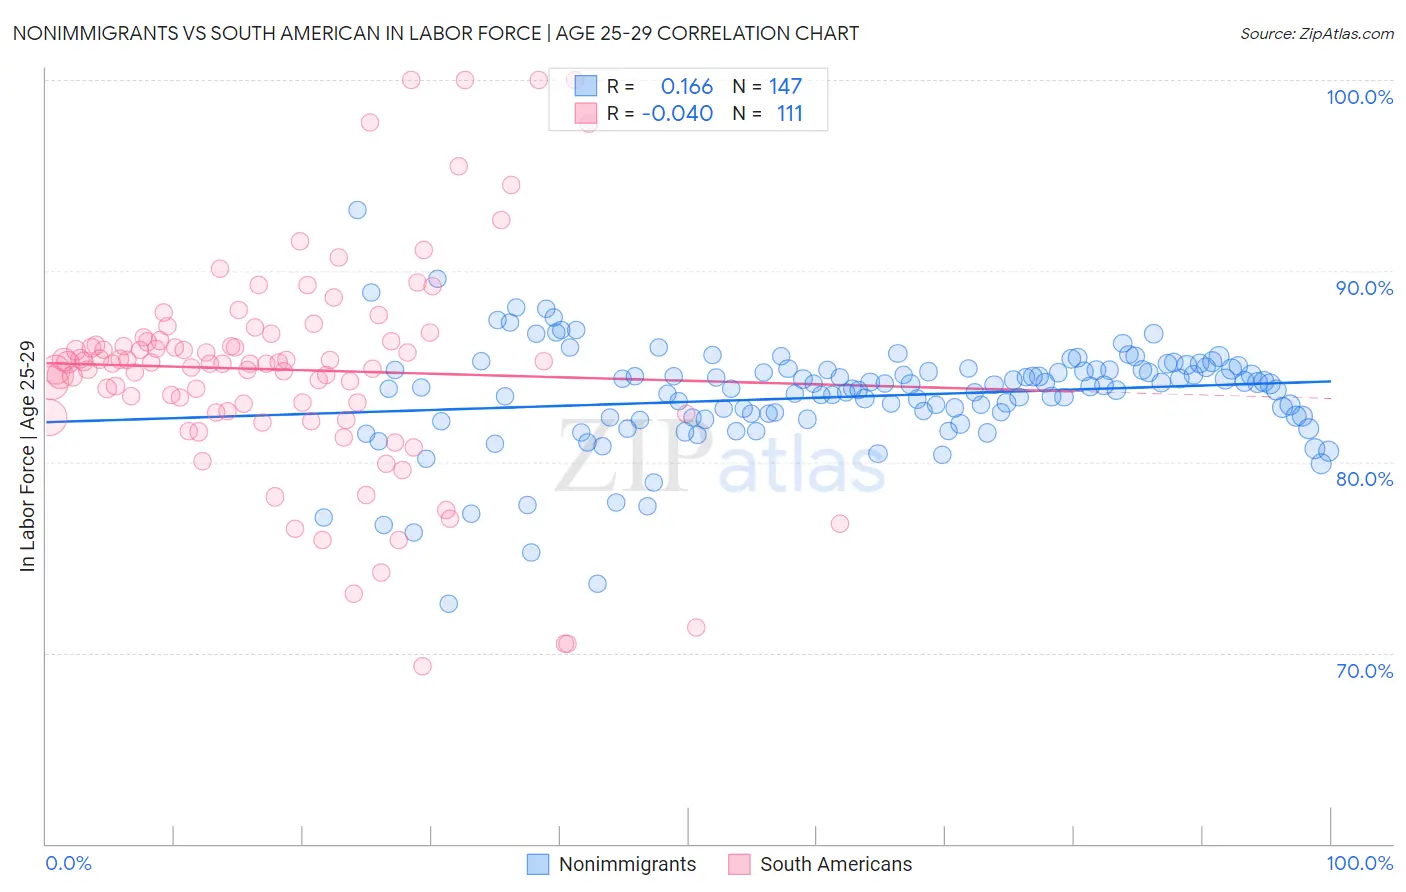
Nonimmigrants vs South American In Labor Force | Age 25-29 Correlation Chart
The statistical analysis conducted on geographies consisting of 582,659,660 people shows a poor positive correlation between the proportion of Nonimmigrants and labor force participation rate among population between the ages 25 and 29 in the United States with a correlation coefficient (R) of 0.166 and weighted average of 83.7%. Similarly, the statistical analysis conducted on geographies consisting of 493,840,082 people shows no correlation between the proportion of South Americans and labor force participation rate among population between the ages 25 and 29 in the United States with a correlation coefficient (R) of -0.040 and weighted average of 84.7%, a difference of 1.1%.
In Labor Force | Age 25-29 Correlation Summary
| Measurement | Nonimmigrants | South American |
| Minimum | 72.6% | 69.3% |
| Maximum | 93.2% | 100.0% |
| Range | 20.6% | 30.7% |
| Mean | 83.4% | 84.8% |
| Median | 83.9% | 85.2% |
| Interquartile 25% (IQ1) | 82.3% | 82.6% |
| Interquartile 75% (IQ3) | 84.8% | 86.4% |
| Interquartile Range (IQR) | 2.5% | 3.7% |
| Standard Deviation (Sample) | 2.8% | 5.7% |
| Standard Deviation (Population) | 2.8% | 5.7% |
Similar Demographics by In Labor Force | Age 25-29
Demographics Similar to Nonimmigrants by In Labor Force | Age 25-29
In terms of in labor force | age 25-29, the demographic groups most similar to Nonimmigrants are Hmong (83.7%, a difference of 0.010%), Immigrants from El Salvador (83.7%, a difference of 0.020%), Cree (83.8%, a difference of 0.030%), Central American (83.7%, a difference of 0.030%), and Bahamian (83.7%, a difference of 0.040%).
| Demographics | Rating | Rank | In Labor Force | Age 25-29 |
| Alsatians | 0.7 /100 | #241 | Tragic 83.9% |
| U.S. Virgin Islanders | 0.6 /100 | #242 | Tragic 83.8% |
| Salvadorans | 0.5 /100 | #243 | Tragic 83.8% |
| Immigrants | Jamaica | 0.4 /100 | #244 | Tragic 83.8% |
| Iroquois | 0.4 /100 | #245 | Tragic 83.8% |
| Cree | 0.3 /100 | #246 | Tragic 83.8% |
| Immigrants | El Salvador | 0.3 /100 | #247 | Tragic 83.7% |
| Immigrants | Nonimmigrants | 0.3 /100 | #248 | Tragic 83.7% |
| Hmong | 0.3 /100 | #249 | Tragic 83.7% |
| Central Americans | 0.2 /100 | #250 | Tragic 83.7% |
| Bahamians | 0.2 /100 | #251 | Tragic 83.7% |
| Guatemalans | 0.2 /100 | #252 | Tragic 83.7% |
| Immigrants | Trinidad and Tobago | 0.2 /100 | #253 | Tragic 83.7% |
| Spaniards | 0.2 /100 | #254 | Tragic 83.7% |
| Haitians | 0.2 /100 | #255 | Tragic 83.7% |
Demographics Similar to South Americans by In Labor Force | Age 25-29
In terms of in labor force | age 25-29, the demographic groups most similar to South Americans are Immigrants from Spain (84.7%, a difference of 0.010%), Indonesian (84.7%, a difference of 0.010%), Argentinean (84.7%, a difference of 0.020%), Ghanaian (84.7%, a difference of 0.020%), and Immigrants from Burma/Myanmar (84.7%, a difference of 0.020%).
| Demographics | Rating | Rank | In Labor Force | Age 25-29 |
| Canadians | 58.5 /100 | #161 | Average 84.7% |
| Immigrants | Colombia | 58.3 /100 | #162 | Average 84.7% |
| Argentineans | 57.9 /100 | #163 | Average 84.7% |
| Ghanaians | 57.6 /100 | #164 | Average 84.7% |
| Immigrants | Burma/Myanmar | 57.4 /100 | #165 | Average 84.7% |
| Immigrants | Spain | 56.9 /100 | #166 | Average 84.7% |
| Indonesians | 56.5 /100 | #167 | Average 84.7% |
| South Americans | 54.9 /100 | #168 | Average 84.7% |
| Celtics | 52.5 /100 | #169 | Average 84.7% |
| Tongans | 52.4 /100 | #170 | Average 84.7% |
| Immigrants | Vietnam | 50.5 /100 | #171 | Average 84.7% |
| Immigrants | Western Europe | 50.4 /100 | #172 | Average 84.7% |
| Assyrians/Chaldeans/Syriacs | 50.2 /100 | #173 | Average 84.7% |
| Palestinians | 50.0 /100 | #174 | Average 84.7% |
| Hungarians | 47.8 /100 | #175 | Average 84.6% |