Nicaraguan vs Menominee In Labor Force | Age 35-44
COMPARE
Nicaraguan
Menominee
In Labor Force | Age 35-44
In Labor Force | Age 35-44 Comparison
Nicaraguans
Menominee
84.1%
IN LABOR FORCE | AGE 35-44
12.1/ 100
METRIC RATING
216th/ 347
METRIC RANK
79.7%
IN LABOR FORCE | AGE 35-44
0.0/ 100
METRIC RATING
329th/ 347
METRIC RANK
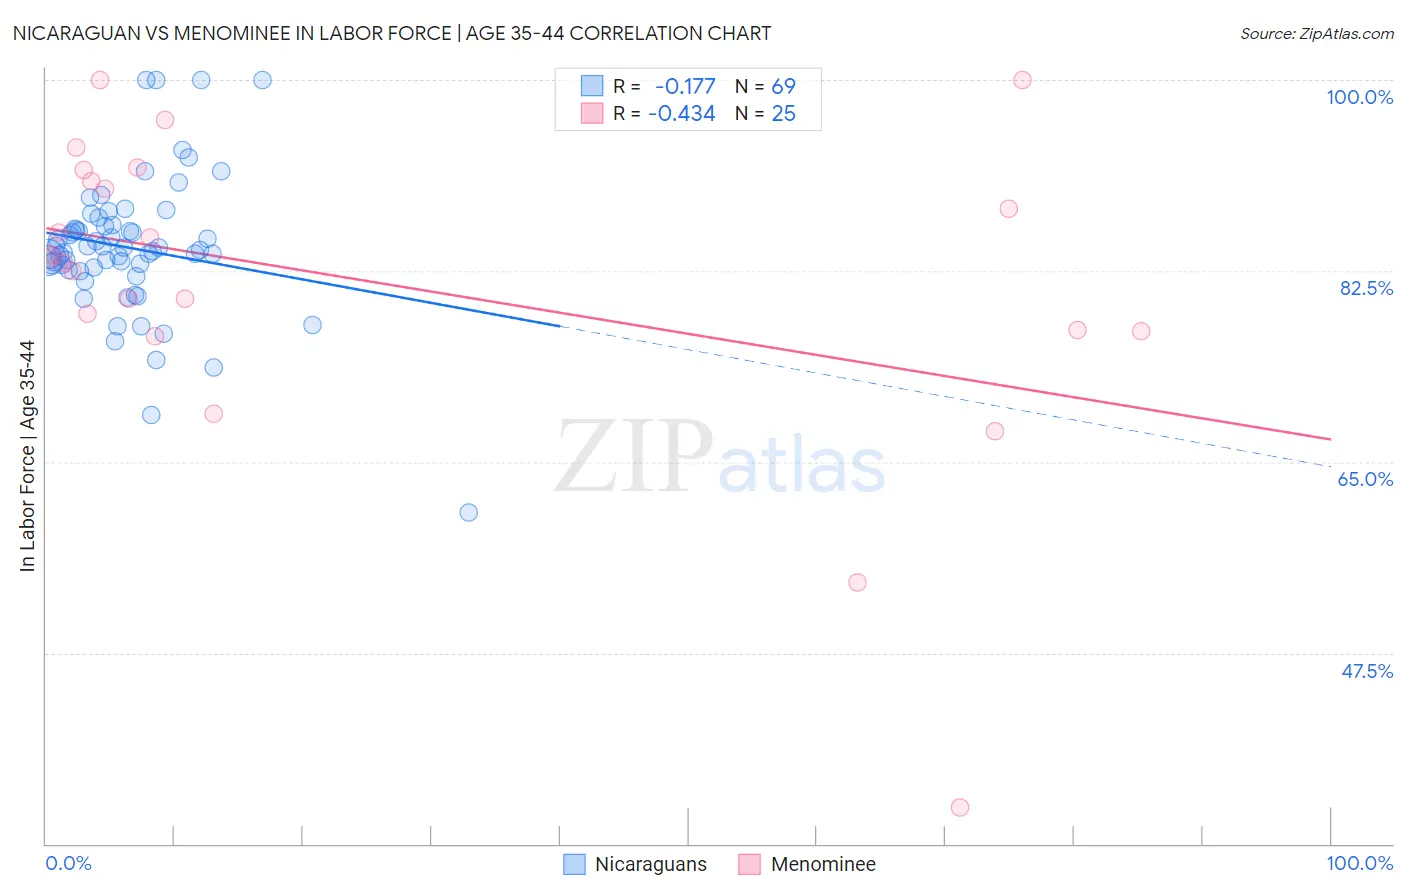
Nicaraguan vs Menominee In Labor Force | Age 35-44 Correlation Chart
The statistical analysis conducted on geographies consisting of 285,645,382 people shows a poor negative correlation between the proportion of Nicaraguans and labor force participation rate among population between the ages 35 and 44 in the United States with a correlation coefficient (R) of -0.177 and weighted average of 84.1%. Similarly, the statistical analysis conducted on geographies consisting of 45,777,730 people shows a moderate negative correlation between the proportion of Menominee and labor force participation rate among population between the ages 35 and 44 in the United States with a correlation coefficient (R) of -0.434 and weighted average of 79.7%, a difference of 5.6%.
In Labor Force | Age 35-44 Correlation Summary
| Measurement | Nicaraguan | Menominee |
| Minimum | 60.4% | 33.3% |
| Maximum | 100.0% | 100.0% |
| Range | 39.6% | 66.7% |
| Mean | 84.6% | 81.7% |
| Median | 84.4% | 83.9% |
| Interquartile 25% (IQ1) | 82.7% | 77.0% |
| Interquartile 75% (IQ3) | 86.7% | 91.2% |
| Interquartile Range (IQR) | 3.9% | 14.2% |
| Standard Deviation (Sample) | 6.4% | 14.5% |
| Standard Deviation (Population) | 6.4% | 14.2% |
Similar Demographics by In Labor Force | Age 35-44
Demographics Similar to Nicaraguans by In Labor Force | Age 35-44
In terms of in labor force | age 35-44, the demographic groups most similar to Nicaraguans are European (84.1%, a difference of 0.0%), Immigrants from Norway (84.1%, a difference of 0.010%), Bangladeshi (84.1%, a difference of 0.020%), Immigrants from Barbados (84.1%, a difference of 0.020%), and Israeli (84.1%, a difference of 0.030%).
| Demographics | Rating | Rank | In Labor Force | Age 35-44 |
| Swiss | 17.4 /100 | #209 | Poor 84.2% |
| New Zealanders | 16.2 /100 | #210 | Poor 84.1% |
| Immigrants | Ecuador | 15.2 /100 | #211 | Poor 84.1% |
| Israelis | 14.0 /100 | #212 | Poor 84.1% |
| Bangladeshis | 13.7 /100 | #213 | Poor 84.1% |
| Immigrants | Barbados | 13.2 /100 | #214 | Poor 84.1% |
| Europeans | 12.2 /100 | #215 | Poor 84.1% |
| Nicaraguans | 12.1 /100 | #216 | Poor 84.1% |
| Immigrants | Norway | 11.7 /100 | #217 | Poor 84.1% |
| Immigrants | Nicaragua | 9.4 /100 | #218 | Tragic 84.1% |
| Sub-Saharan Africans | 9.3 /100 | #219 | Tragic 84.1% |
| French | 7.5 /100 | #220 | Tragic 84.0% |
| Icelanders | 6.7 /100 | #221 | Tragic 84.0% |
| Assyrians/Chaldeans/Syriacs | 6.6 /100 | #222 | Tragic 84.0% |
| Immigrants | Panama | 6.4 /100 | #223 | Tragic 84.0% |
Demographics Similar to Menominee by In Labor Force | Age 35-44
In terms of in labor force | age 35-44, the demographic groups most similar to Menominee are Cheyenne (79.5%, a difference of 0.20%), Houma (79.5%, a difference of 0.22%), Ute (79.4%, a difference of 0.28%), Creek (80.0%, a difference of 0.44%), and Kiowa (79.2%, a difference of 0.61%).
| Demographics | Rating | Rank | In Labor Force | Age 35-44 |
| Paiute | 0.0 /100 | #322 | Tragic 80.6% |
| Yaqui | 0.0 /100 | #323 | Tragic 80.5% |
| Choctaw | 0.0 /100 | #324 | Tragic 80.5% |
| Dutch West Indians | 0.0 /100 | #325 | Tragic 80.4% |
| Seminole | 0.0 /100 | #326 | Tragic 80.4% |
| Sioux | 0.0 /100 | #327 | Tragic 80.2% |
| Creek | 0.0 /100 | #328 | Tragic 80.0% |
| Menominee | 0.0 /100 | #329 | Tragic 79.7% |
| Cheyenne | 0.0 /100 | #330 | Tragic 79.5% |
| Houma | 0.0 /100 | #331 | Tragic 79.5% |
| Ute | 0.0 /100 | #332 | Tragic 79.4% |
| Kiowa | 0.0 /100 | #333 | Tragic 79.2% |
| Yakama | 0.0 /100 | #334 | Tragic 79.0% |
| Natives/Alaskans | 0.0 /100 | #335 | Tragic 78.9% |
| Arapaho | 0.0 /100 | #336 | Tragic 78.1% |