Nicaraguan vs Immigrants from Jordan In Labor Force | Age 35-44
COMPARE
Nicaraguan
Immigrants from Jordan
In Labor Force | Age 35-44
In Labor Force | Age 35-44 Comparison
Nicaraguans
Immigrants from Jordan
84.1%
IN LABOR FORCE | AGE 35-44
12.1/ 100
METRIC RATING
216th/ 347
METRIC RANK
84.4%
IN LABOR FORCE | AGE 35-44
52.5/ 100
METRIC RATING
170th/ 347
METRIC RANK
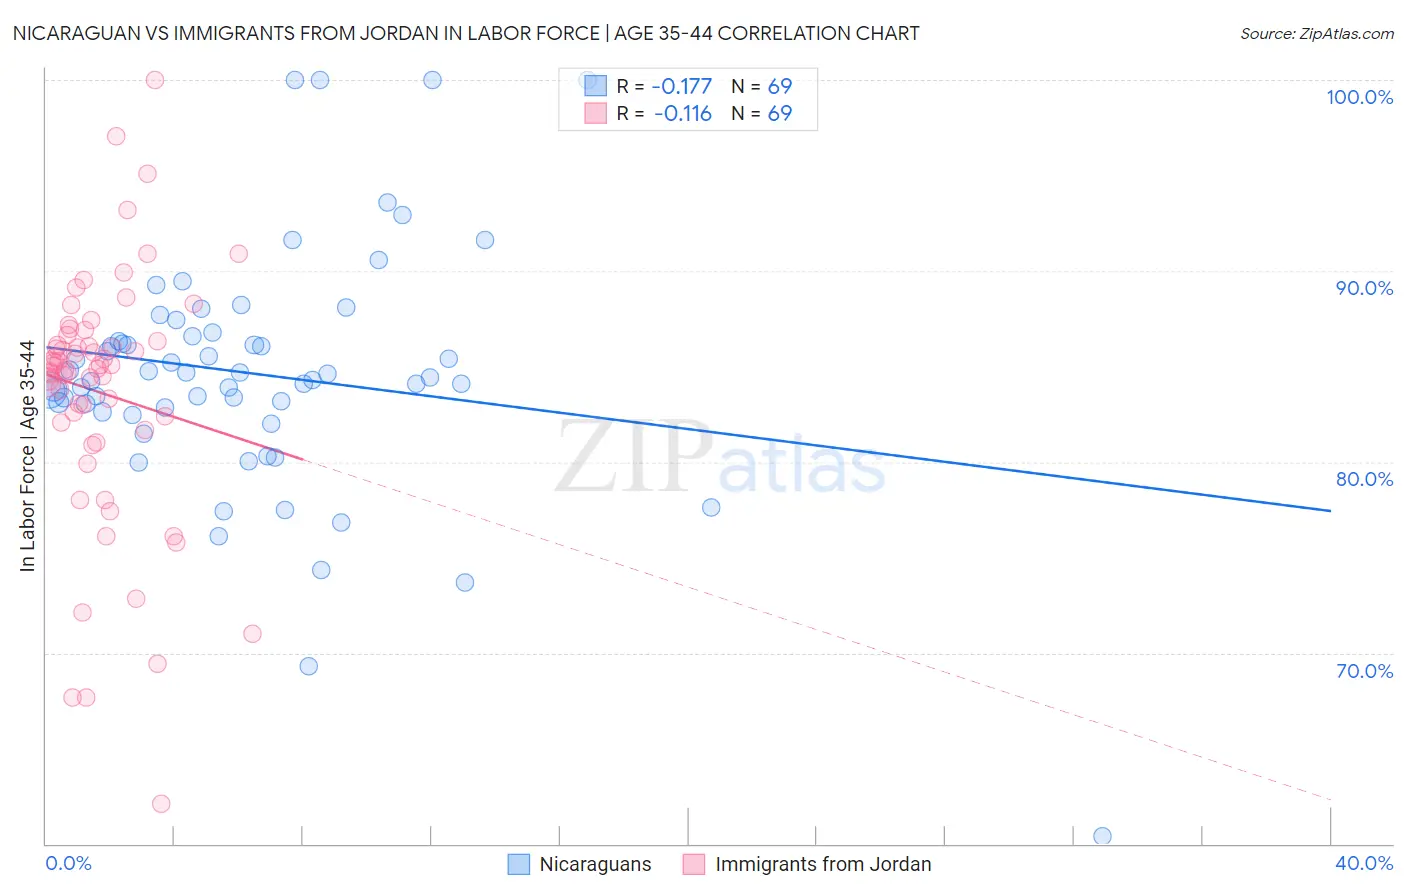
Nicaraguan vs Immigrants from Jordan In Labor Force | Age 35-44 Correlation Chart
The statistical analysis conducted on geographies consisting of 285,645,382 people shows a poor negative correlation between the proportion of Nicaraguans and labor force participation rate among population between the ages 35 and 44 in the United States with a correlation coefficient (R) of -0.177 and weighted average of 84.1%. Similarly, the statistical analysis conducted on geographies consisting of 181,251,631 people shows a poor negative correlation between the proportion of Immigrants from Jordan and labor force participation rate among population between the ages 35 and 44 in the United States with a correlation coefficient (R) of -0.116 and weighted average of 84.4%, a difference of 0.34%.
In Labor Force | Age 35-44 Correlation Summary
| Measurement | Nicaraguan | Immigrants from Jordan |
| Minimum | 60.4% | 62.1% |
| Maximum | 100.0% | 100.0% |
| Range | 39.6% | 37.9% |
| Mean | 84.6% | 83.6% |
| Median | 84.4% | 85.0% |
| Interquartile 25% (IQ1) | 82.7% | 81.9% |
| Interquartile 75% (IQ3) | 86.7% | 86.5% |
| Interquartile Range (IQR) | 3.9% | 4.6% |
| Standard Deviation (Sample) | 6.4% | 6.6% |
| Standard Deviation (Population) | 6.4% | 6.6% |
Similar Demographics by In Labor Force | Age 35-44
Demographics Similar to Nicaraguans by In Labor Force | Age 35-44
In terms of in labor force | age 35-44, the demographic groups most similar to Nicaraguans are European (84.1%, a difference of 0.0%), Immigrants from Norway (84.1%, a difference of 0.010%), Bangladeshi (84.1%, a difference of 0.020%), Immigrants from Barbados (84.1%, a difference of 0.020%), and Israeli (84.1%, a difference of 0.030%).
| Demographics | Rating | Rank | In Labor Force | Age 35-44 |
| Swiss | 17.4 /100 | #209 | Poor 84.2% |
| New Zealanders | 16.2 /100 | #210 | Poor 84.1% |
| Immigrants | Ecuador | 15.2 /100 | #211 | Poor 84.1% |
| Israelis | 14.0 /100 | #212 | Poor 84.1% |
| Bangladeshis | 13.7 /100 | #213 | Poor 84.1% |
| Immigrants | Barbados | 13.2 /100 | #214 | Poor 84.1% |
| Europeans | 12.2 /100 | #215 | Poor 84.1% |
| Nicaraguans | 12.1 /100 | #216 | Poor 84.1% |
| Immigrants | Norway | 11.7 /100 | #217 | Poor 84.1% |
| Immigrants | Nicaragua | 9.4 /100 | #218 | Tragic 84.1% |
| Sub-Saharan Africans | 9.3 /100 | #219 | Tragic 84.1% |
| French | 7.5 /100 | #220 | Tragic 84.0% |
| Icelanders | 6.7 /100 | #221 | Tragic 84.0% |
| Assyrians/Chaldeans/Syriacs | 6.6 /100 | #222 | Tragic 84.0% |
| Immigrants | Panama | 6.4 /100 | #223 | Tragic 84.0% |
Demographics Similar to Immigrants from Jordan by In Labor Force | Age 35-44
In terms of in labor force | age 35-44, the demographic groups most similar to Immigrants from Jordan are Irish (84.4%, a difference of 0.0%), Immigrants from Afghanistan (84.4%, a difference of 0.0%), Jordanian (84.4%, a difference of 0.0%), Scandinavian (84.4%, a difference of 0.010%), and Immigrants from Trinidad and Tobago (84.4%, a difference of 0.010%).
| Demographics | Rating | Rank | In Labor Force | Age 35-44 |
| Aleuts | 59.1 /100 | #163 | Average 84.4% |
| Nigerians | 58.9 /100 | #164 | Average 84.4% |
| Venezuelans | 58.1 /100 | #165 | Average 84.4% |
| Alsatians | 55.2 /100 | #166 | Average 84.4% |
| Immigrants | Portugal | 55.2 /100 | #167 | Average 84.4% |
| Irish | 53.1 /100 | #168 | Average 84.4% |
| Immigrants | Afghanistan | 52.7 /100 | #169 | Average 84.4% |
| Immigrants | Jordan | 52.5 /100 | #170 | Average 84.4% |
| Jordanians | 51.7 /100 | #171 | Average 84.4% |
| Scandinavians | 51.2 /100 | #172 | Average 84.4% |
| Immigrants | Trinidad and Tobago | 50.7 /100 | #173 | Average 84.4% |
| Immigrants | Iran | 50.0 /100 | #174 | Average 84.4% |
| Pakistanis | 48.2 /100 | #175 | Average 84.4% |
| Sri Lankans | 47.3 /100 | #176 | Average 84.4% |
| French Canadians | 44.3 /100 | #177 | Average 84.3% |