Nicaraguan vs Immigrants from Sweden In Labor Force | Age 35-44
COMPARE
Nicaraguan
Immigrants from Sweden
In Labor Force | Age 35-44
In Labor Force | Age 35-44 Comparison
Nicaraguans
Immigrants from Sweden
84.1%
IN LABOR FORCE | AGE 35-44
12.1/ 100
METRIC RATING
216th/ 347
METRIC RANK
84.8%
IN LABOR FORCE | AGE 35-44
95.2/ 100
METRIC RATING
104th/ 347
METRIC RANK
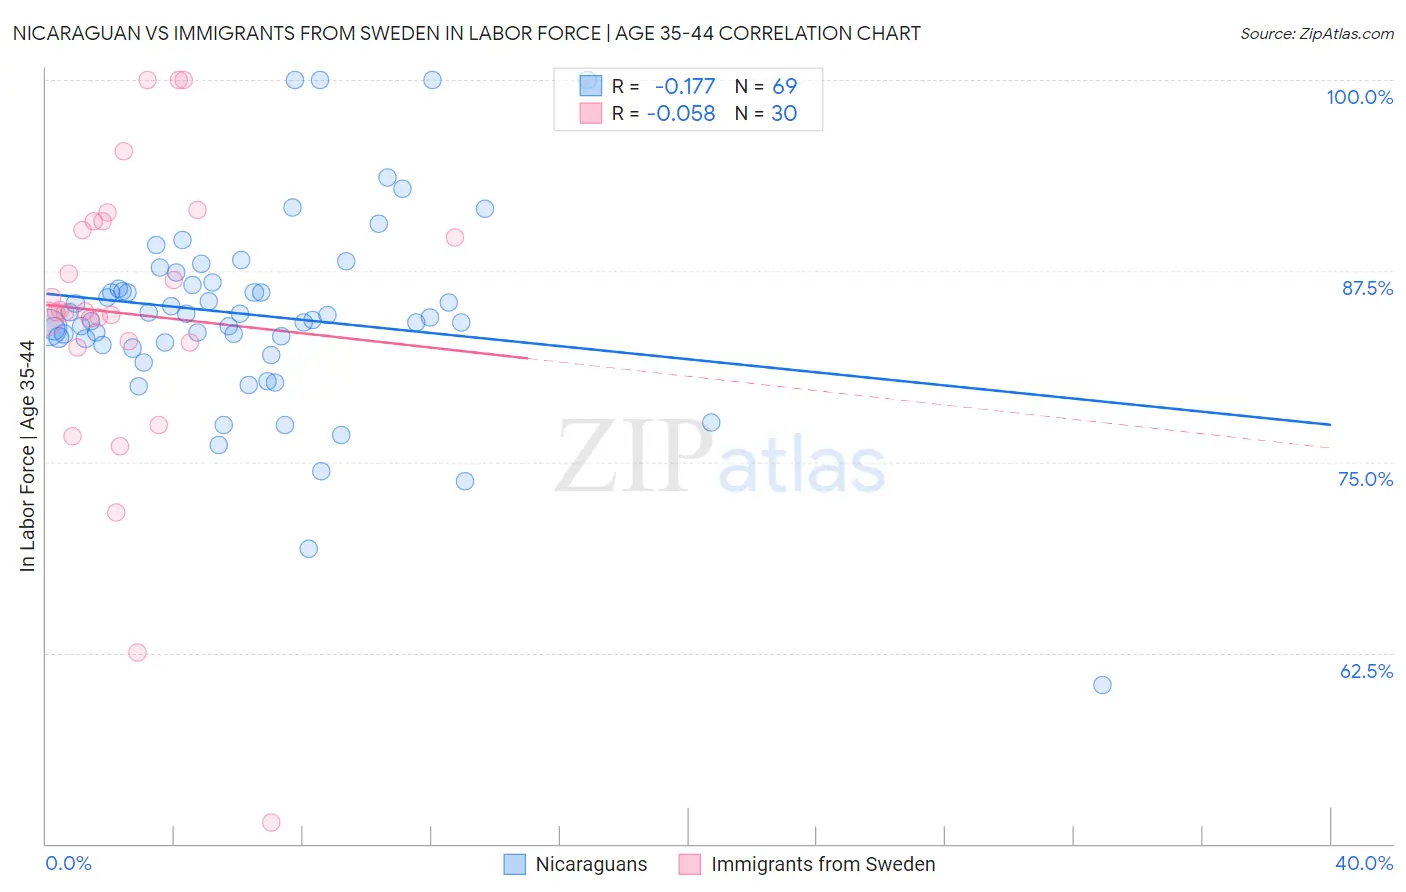
Nicaraguan vs Immigrants from Sweden In Labor Force | Age 35-44 Correlation Chart
The statistical analysis conducted on geographies consisting of 285,645,382 people shows a poor negative correlation between the proportion of Nicaraguans and labor force participation rate among population between the ages 35 and 44 in the United States with a correlation coefficient (R) of -0.177 and weighted average of 84.1%. Similarly, the statistical analysis conducted on geographies consisting of 164,707,751 people shows a slight negative correlation between the proportion of Immigrants from Sweden and labor force participation rate among population between the ages 35 and 44 in the United States with a correlation coefficient (R) of -0.058 and weighted average of 84.8%, a difference of 0.81%.
In Labor Force | Age 35-44 Correlation Summary
| Measurement | Nicaraguan | Immigrants from Sweden |
| Minimum | 60.4% | 51.4% |
| Maximum | 100.0% | 100.0% |
| Range | 39.6% | 48.6% |
| Mean | 84.6% | 84.7% |
| Median | 84.4% | 84.8% |
| Interquartile 25% (IQ1) | 82.7% | 82.8% |
| Interquartile 75% (IQ3) | 86.7% | 90.8% |
| Interquartile Range (IQR) | 3.9% | 7.9% |
| Standard Deviation (Sample) | 6.4% | 10.2% |
| Standard Deviation (Population) | 6.4% | 10.0% |
Similar Demographics by In Labor Force | Age 35-44
Demographics Similar to Nicaraguans by In Labor Force | Age 35-44
In terms of in labor force | age 35-44, the demographic groups most similar to Nicaraguans are European (84.1%, a difference of 0.0%), Immigrants from Norway (84.1%, a difference of 0.010%), Bangladeshi (84.1%, a difference of 0.020%), Immigrants from Barbados (84.1%, a difference of 0.020%), and Israeli (84.1%, a difference of 0.030%).
| Demographics | Rating | Rank | In Labor Force | Age 35-44 |
| Swiss | 17.4 /100 | #209 | Poor 84.2% |
| New Zealanders | 16.2 /100 | #210 | Poor 84.1% |
| Immigrants | Ecuador | 15.2 /100 | #211 | Poor 84.1% |
| Israelis | 14.0 /100 | #212 | Poor 84.1% |
| Bangladeshis | 13.7 /100 | #213 | Poor 84.1% |
| Immigrants | Barbados | 13.2 /100 | #214 | Poor 84.1% |
| Europeans | 12.2 /100 | #215 | Poor 84.1% |
| Nicaraguans | 12.1 /100 | #216 | Poor 84.1% |
| Immigrants | Norway | 11.7 /100 | #217 | Poor 84.1% |
| Immigrants | Nicaragua | 9.4 /100 | #218 | Tragic 84.1% |
| Sub-Saharan Africans | 9.3 /100 | #219 | Tragic 84.1% |
| French | 7.5 /100 | #220 | Tragic 84.0% |
| Icelanders | 6.7 /100 | #221 | Tragic 84.0% |
| Assyrians/Chaldeans/Syriacs | 6.6 /100 | #222 | Tragic 84.0% |
| Immigrants | Panama | 6.4 /100 | #223 | Tragic 84.0% |
Demographics Similar to Immigrants from Sweden by In Labor Force | Age 35-44
In terms of in labor force | age 35-44, the demographic groups most similar to Immigrants from Sweden are Immigrants from Southern Europe (84.8%, a difference of 0.0%), Immigrants from Belarus (84.8%, a difference of 0.0%), Immigrants from Australia (84.8%, a difference of 0.010%), South American (84.8%, a difference of 0.010%), and Immigrants from Bahamas (84.8%, a difference of 0.010%).
| Demographics | Rating | Rank | In Labor Force | Age 35-44 |
| Egyptians | 96.6 /100 | #97 | Exceptional 84.8% |
| Indians (Asian) | 96.1 /100 | #98 | Exceptional 84.8% |
| Haitians | 96.0 /100 | #99 | Exceptional 84.8% |
| Immigrants | Czechoslovakia | 95.9 /100 | #100 | Exceptional 84.8% |
| Immigrants | Australia | 95.5 /100 | #101 | Exceptional 84.8% |
| Immigrants | Southern Europe | 95.3 /100 | #102 | Exceptional 84.8% |
| Immigrants | Belarus | 95.3 /100 | #103 | Exceptional 84.8% |
| Immigrants | Sweden | 95.2 /100 | #104 | Exceptional 84.8% |
| South Americans | 95.0 /100 | #105 | Exceptional 84.8% |
| Immigrants | Bahamas | 94.8 /100 | #106 | Exceptional 84.8% |
| Immigrants | Romania | 94.7 /100 | #107 | Exceptional 84.8% |
| Immigrants | Argentina | 94.5 /100 | #108 | Exceptional 84.8% |
| Immigrants | Russia | 94.5 /100 | #109 | Exceptional 84.8% |
| Filipinos | 93.8 /100 | #110 | Exceptional 84.7% |
| Ukrainians | 93.5 /100 | #111 | Exceptional 84.7% |