New Zealander vs Seminole In Labor Force | Age 45-54
COMPARE
New Zealander
Seminole
In Labor Force | Age 45-54
In Labor Force | Age 45-54 Comparison
New Zealanders
Seminole
82.6%
IN LABOR FORCE | AGE 45-54
32.7/ 100
METRIC RATING
183rd/ 347
METRIC RANK
78.1%
IN LABOR FORCE | AGE 45-54
0.0/ 100
METRIC RATING
326th/ 347
METRIC RANK
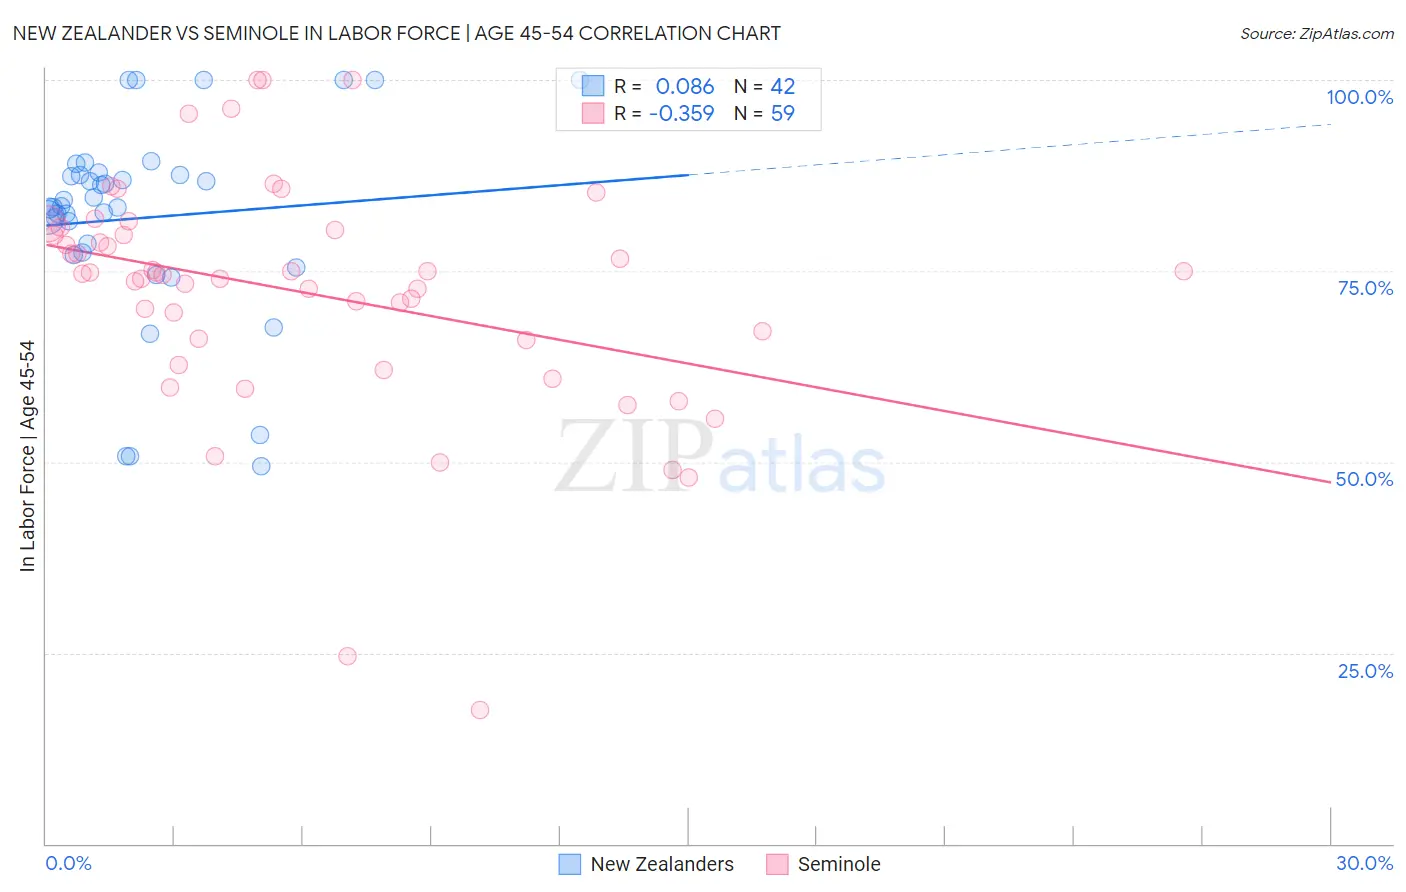
New Zealander vs Seminole In Labor Force | Age 45-54 Correlation Chart
The statistical analysis conducted on geographies consisting of 106,893,941 people shows a slight positive correlation between the proportion of New Zealanders and labor force participation rate among population between the ages 45 and 54 in the United States with a correlation coefficient (R) of 0.086 and weighted average of 82.6%. Similarly, the statistical analysis conducted on geographies consisting of 118,297,106 people shows a mild negative correlation between the proportion of Seminole and labor force participation rate among population between the ages 45 and 54 in the United States with a correlation coefficient (R) of -0.359 and weighted average of 78.1%, a difference of 5.8%.
In Labor Force | Age 45-54 Correlation Summary
| Measurement | New Zealander | Seminole |
| Minimum | 49.5% | 17.5% |
| Maximum | 100.0% | 100.0% |
| Range | 50.5% | 82.5% |
| Mean | 82.0% | 72.2% |
| Median | 83.4% | 74.7% |
| Interquartile 25% (IQ1) | 77.4% | 65.9% |
| Interquartile 75% (IQ3) | 87.5% | 80.4% |
| Interquartile Range (IQR) | 10.1% | 14.5% |
| Standard Deviation (Sample) | 12.9% | 15.5% |
| Standard Deviation (Population) | 12.7% | 15.4% |
Similar Demographics by In Labor Force | Age 45-54
Demographics Similar to New Zealanders by In Labor Force | Age 45-54
In terms of in labor force | age 45-54, the demographic groups most similar to New Zealanders are European (82.6%, a difference of 0.0%), Immigrants from England (82.6%, a difference of 0.0%), Immigrants from Hungary (82.7%, a difference of 0.040%), Irish (82.6%, a difference of 0.040%), and Hungarian (82.7%, a difference of 0.050%).
| Demographics | Rating | Rank | In Labor Force | Age 45-54 |
| Northern Europeans | 46.9 /100 | #176 | Average 82.7% |
| Immigrants | Nicaragua | 44.6 /100 | #177 | Average 82.7% |
| Nigerians | 40.5 /100 | #178 | Average 82.7% |
| Immigrants | Switzerland | 39.4 /100 | #179 | Fair 82.7% |
| Hungarians | 38.0 /100 | #180 | Fair 82.7% |
| Israelis | 37.7 /100 | #181 | Fair 82.7% |
| Immigrants | Hungary | 37.1 /100 | #182 | Fair 82.7% |
| New Zealanders | 32.7 /100 | #183 | Fair 82.6% |
| Europeans | 32.6 /100 | #184 | Fair 82.6% |
| Immigrants | England | 32.2 /100 | #185 | Fair 82.6% |
| Irish | 29.2 /100 | #186 | Fair 82.6% |
| Immigrants | Costa Rica | 28.3 /100 | #187 | Fair 82.6% |
| South Africans | 28.0 /100 | #188 | Fair 82.6% |
| Syrians | 26.0 /100 | #189 | Fair 82.6% |
| British | 25.7 /100 | #190 | Fair 82.6% |
Demographics Similar to Seminole by In Labor Force | Age 45-54
In terms of in labor force | age 45-54, the demographic groups most similar to Seminole are Cajun (78.1%, a difference of 0.0%), Choctaw (78.2%, a difference of 0.050%), Dutch West Indian (78.2%, a difference of 0.14%), Kiowa (78.3%, a difference of 0.16%), and Sioux (78.0%, a difference of 0.23%).
| Demographics | Rating | Rank | In Labor Force | Age 45-54 |
| Cherokee | 0.0 /100 | #319 | Tragic 79.0% |
| Yaqui | 0.0 /100 | #320 | Tragic 78.9% |
| Yup'ik | 0.0 /100 | #321 | Tragic 78.6% |
| Crow | 0.0 /100 | #322 | Tragic 78.3% |
| Kiowa | 0.0 /100 | #323 | Tragic 78.3% |
| Dutch West Indians | 0.0 /100 | #324 | Tragic 78.2% |
| Choctaw | 0.0 /100 | #325 | Tragic 78.2% |
| Seminole | 0.0 /100 | #326 | Tragic 78.1% |
| Cajuns | 0.0 /100 | #327 | Tragic 78.1% |
| Sioux | 0.0 /100 | #328 | Tragic 78.0% |
| Creek | 0.0 /100 | #329 | Tragic 77.7% |
| Cheyenne | 0.0 /100 | #330 | Tragic 77.6% |
| Tsimshian | 0.0 /100 | #331 | Tragic 77.4% |
| Menominee | 0.0 /100 | #332 | Tragic 77.4% |
| Natives/Alaskans | 0.0 /100 | #333 | Tragic 77.1% |