New Zealander vs Iraqi In Labor Force | Age 45-54
COMPARE
New Zealander
Iraqi
In Labor Force | Age 45-54
In Labor Force | Age 45-54 Comparison
New Zealanders
Iraqis
82.6%
IN LABOR FORCE | AGE 45-54
32.7/ 100
METRIC RATING
183rd/ 347
METRIC RANK
82.2%
IN LABOR FORCE | AGE 45-54
5.6/ 100
METRIC RATING
215th/ 347
METRIC RANK
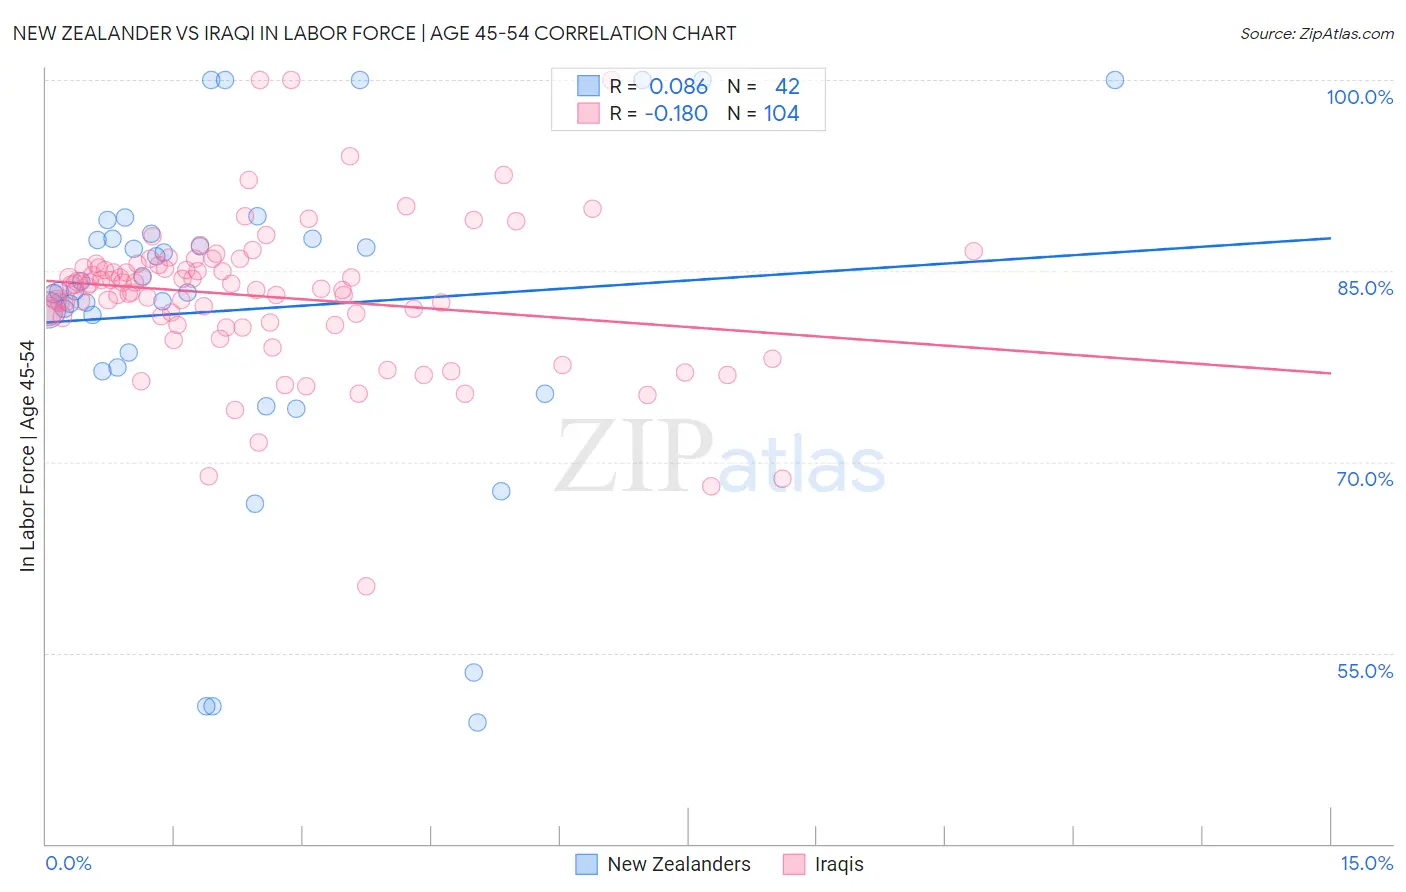
New Zealander vs Iraqi In Labor Force | Age 45-54 Correlation Chart
The statistical analysis conducted on geographies consisting of 106,893,941 people shows a slight positive correlation between the proportion of New Zealanders and labor force participation rate among population between the ages 45 and 54 in the United States with a correlation coefficient (R) of 0.086 and weighted average of 82.6%. Similarly, the statistical analysis conducted on geographies consisting of 170,631,505 people shows a poor negative correlation between the proportion of Iraqis and labor force participation rate among population between the ages 45 and 54 in the United States with a correlation coefficient (R) of -0.180 and weighted average of 82.2%, a difference of 0.47%.
In Labor Force | Age 45-54 Correlation Summary
| Measurement | New Zealander | Iraqi |
| Minimum | 49.5% | 60.2% |
| Maximum | 100.0% | 100.0% |
| Range | 50.5% | 39.8% |
| Mean | 82.0% | 83.0% |
| Median | 83.4% | 83.7% |
| Interquartile 25% (IQ1) | 77.4% | 80.9% |
| Interquartile 75% (IQ3) | 87.5% | 85.4% |
| Interquartile Range (IQR) | 10.1% | 4.5% |
| Standard Deviation (Sample) | 12.9% | 5.9% |
| Standard Deviation (Population) | 12.7% | 5.9% |
Similar Demographics by In Labor Force | Age 45-54
Demographics Similar to New Zealanders by In Labor Force | Age 45-54
In terms of in labor force | age 45-54, the demographic groups most similar to New Zealanders are European (82.6%, a difference of 0.0%), Immigrants from England (82.6%, a difference of 0.0%), Immigrants from Hungary (82.7%, a difference of 0.040%), Irish (82.6%, a difference of 0.040%), and Hungarian (82.7%, a difference of 0.050%).
| Demographics | Rating | Rank | In Labor Force | Age 45-54 |
| Northern Europeans | 46.9 /100 | #176 | Average 82.7% |
| Immigrants | Nicaragua | 44.6 /100 | #177 | Average 82.7% |
| Nigerians | 40.5 /100 | #178 | Average 82.7% |
| Immigrants | Switzerland | 39.4 /100 | #179 | Fair 82.7% |
| Hungarians | 38.0 /100 | #180 | Fair 82.7% |
| Israelis | 37.7 /100 | #181 | Fair 82.7% |
| Immigrants | Hungary | 37.1 /100 | #182 | Fair 82.7% |
| New Zealanders | 32.7 /100 | #183 | Fair 82.6% |
| Europeans | 32.6 /100 | #184 | Fair 82.6% |
| Immigrants | England | 32.2 /100 | #185 | Fair 82.6% |
| Irish | 29.2 /100 | #186 | Fair 82.6% |
| Immigrants | Costa Rica | 28.3 /100 | #187 | Fair 82.6% |
| South Africans | 28.0 /100 | #188 | Fair 82.6% |
| Syrians | 26.0 /100 | #189 | Fair 82.6% |
| British | 25.7 /100 | #190 | Fair 82.6% |
Demographics Similar to Iraqis by In Labor Force | Age 45-54
In terms of in labor force | age 45-54, the demographic groups most similar to Iraqis are Immigrants from Panama (82.2%, a difference of 0.0%), Immigrants from Uzbekistan (82.3%, a difference of 0.010%), Scottish (82.2%, a difference of 0.010%), Ecuadorian (82.3%, a difference of 0.030%), and Immigrants from Syria (82.3%, a difference of 0.040%).
| Demographics | Rating | Rank | In Labor Force | Age 45-54 |
| Native Hawaiians | 8.5 /100 | #208 | Tragic 82.3% |
| Immigrants | Lebanon | 7.4 /100 | #209 | Tragic 82.3% |
| Immigrants | Bahamas | 7.1 /100 | #210 | Tragic 82.3% |
| Immigrants | Syria | 6.6 /100 | #211 | Tragic 82.3% |
| Ecuadorians | 6.3 /100 | #212 | Tragic 82.3% |
| Immigrants | Uzbekistan | 5.8 /100 | #213 | Tragic 82.3% |
| Immigrants | Panama | 5.6 /100 | #214 | Tragic 82.2% |
| Iraqis | 5.6 /100 | #215 | Tragic 82.2% |
| Scottish | 5.3 /100 | #216 | Tragic 82.2% |
| Portuguese | 4.7 /100 | #217 | Tragic 82.2% |
| English | 4.4 /100 | #218 | Tragic 82.2% |
| French | 4.1 /100 | #219 | Tragic 82.2% |
| Bahamians | 3.6 /100 | #220 | Tragic 82.2% |
| Panamanians | 3.5 /100 | #221 | Tragic 82.2% |
| Immigrants | Ecuador | 3.4 /100 | #222 | Tragic 82.2% |