New Zealander vs West Indian In Labor Force | Age 45-54
COMPARE
New Zealander
West Indian
In Labor Force | Age 45-54
In Labor Force | Age 45-54 Comparison
New Zealanders
West Indians
82.6%
IN LABOR FORCE | AGE 45-54
32.7/ 100
METRIC RATING
183rd/ 347
METRIC RANK
81.4%
IN LABOR FORCE | AGE 45-54
0.1/ 100
METRIC RATING
267th/ 347
METRIC RANK
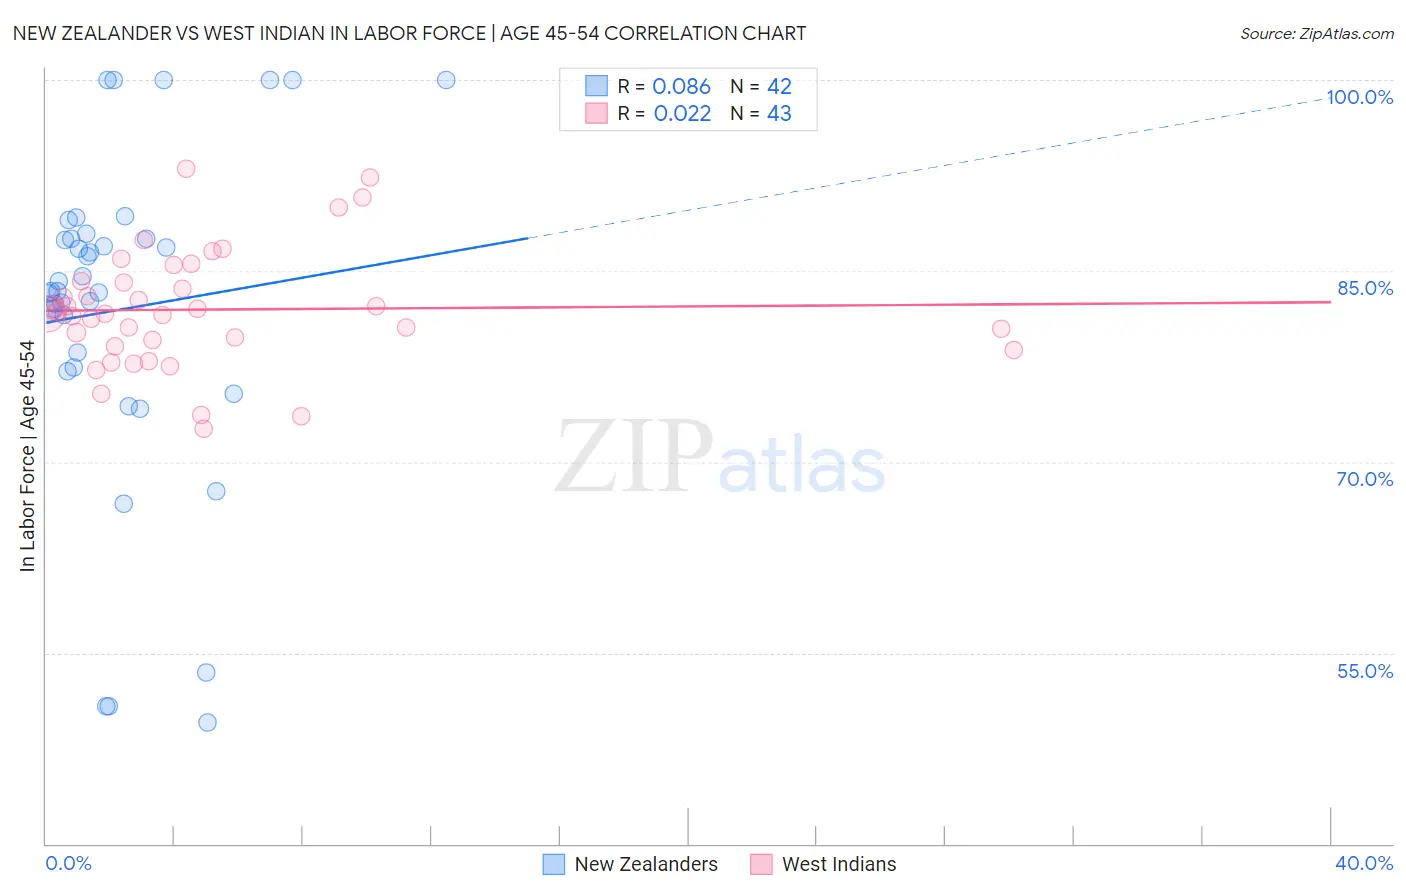
New Zealander vs West Indian In Labor Force | Age 45-54 Correlation Chart
The statistical analysis conducted on geographies consisting of 106,893,941 people shows a slight positive correlation between the proportion of New Zealanders and labor force participation rate among population between the ages 45 and 54 in the United States with a correlation coefficient (R) of 0.086 and weighted average of 82.6%. Similarly, the statistical analysis conducted on geographies consisting of 253,868,267 people shows no correlation between the proportion of West Indians and labor force participation rate among population between the ages 45 and 54 in the United States with a correlation coefficient (R) of 0.022 and weighted average of 81.4%, a difference of 1.5%.
In Labor Force | Age 45-54 Correlation Summary
| Measurement | New Zealander | West Indian |
| Minimum | 49.5% | 72.6% |
| Maximum | 100.0% | 93.0% |
| Range | 50.5% | 20.4% |
| Mean | 82.0% | 82.0% |
| Median | 83.4% | 81.7% |
| Interquartile 25% (IQ1) | 77.4% | 79.0% |
| Interquartile 75% (IQ3) | 87.5% | 84.2% |
| Interquartile Range (IQR) | 10.1% | 5.1% |
| Standard Deviation (Sample) | 12.9% | 4.6% |
| Standard Deviation (Population) | 12.7% | 4.6% |
Similar Demographics by In Labor Force | Age 45-54
Demographics Similar to New Zealanders by In Labor Force | Age 45-54
In terms of in labor force | age 45-54, the demographic groups most similar to New Zealanders are European (82.6%, a difference of 0.0%), Immigrants from England (82.6%, a difference of 0.0%), Immigrants from Hungary (82.7%, a difference of 0.040%), Irish (82.6%, a difference of 0.040%), and Hungarian (82.7%, a difference of 0.050%).
| Demographics | Rating | Rank | In Labor Force | Age 45-54 |
| Northern Europeans | 46.9 /100 | #176 | Average 82.7% |
| Immigrants | Nicaragua | 44.6 /100 | #177 | Average 82.7% |
| Nigerians | 40.5 /100 | #178 | Average 82.7% |
| Immigrants | Switzerland | 39.4 /100 | #179 | Fair 82.7% |
| Hungarians | 38.0 /100 | #180 | Fair 82.7% |
| Israelis | 37.7 /100 | #181 | Fair 82.7% |
| Immigrants | Hungary | 37.1 /100 | #182 | Fair 82.7% |
| New Zealanders | 32.7 /100 | #183 | Fair 82.6% |
| Europeans | 32.6 /100 | #184 | Fair 82.6% |
| Immigrants | England | 32.2 /100 | #185 | Fair 82.6% |
| Irish | 29.2 /100 | #186 | Fair 82.6% |
| Immigrants | Costa Rica | 28.3 /100 | #187 | Fair 82.6% |
| South Africans | 28.0 /100 | #188 | Fair 82.6% |
| Syrians | 26.0 /100 | #189 | Fair 82.6% |
| British | 25.7 /100 | #190 | Fair 82.6% |
Demographics Similar to West Indians by In Labor Force | Age 45-54
In terms of in labor force | age 45-54, the demographic groups most similar to West Indians are Immigrants from St. Vincent and the Grenadines (81.4%, a difference of 0.0%), Immigrants from Honduras (81.4%, a difference of 0.020%), Alsatian (81.3%, a difference of 0.040%), Bangladeshi (81.3%, a difference of 0.070%), and Honduran (81.4%, a difference of 0.080%).
| Demographics | Rating | Rank | In Labor Force | Age 45-54 |
| Spaniards | 0.1 /100 | #260 | Tragic 81.5% |
| Hawaiians | 0.1 /100 | #261 | Tragic 81.5% |
| Immigrants | Guyana | 0.1 /100 | #262 | Tragic 81.5% |
| Indonesians | 0.1 /100 | #263 | Tragic 81.5% |
| Immigrants | West Indies | 0.1 /100 | #264 | Tragic 81.5% |
| Hondurans | 0.1 /100 | #265 | Tragic 81.4% |
| Immigrants | St. Vincent and the Grenadines | 0.1 /100 | #266 | Tragic 81.4% |
| West Indians | 0.1 /100 | #267 | Tragic 81.4% |
| Immigrants | Honduras | 0.0 /100 | #268 | Tragic 81.4% |
| Alsatians | 0.0 /100 | #269 | Tragic 81.3% |
| Bangladeshis | 0.0 /100 | #270 | Tragic 81.3% |
| Immigrants | Barbados | 0.0 /100 | #271 | Tragic 81.3% |
| Spanish | 0.0 /100 | #272 | Tragic 81.3% |
| Chippewa | 0.0 /100 | #273 | Tragic 81.3% |
| British West Indians | 0.0 /100 | #274 | Tragic 81.2% |