New Zealander vs Potawatomi In Labor Force | Age 45-54
COMPARE
New Zealander
Potawatomi
In Labor Force | Age 45-54
In Labor Force | Age 45-54 Comparison
New Zealanders
Potawatomi
82.6%
IN LABOR FORCE | AGE 45-54
32.7/ 100
METRIC RATING
183rd/ 347
METRIC RANK
80.0%
IN LABOR FORCE | AGE 45-54
0.0/ 100
METRIC RATING
309th/ 347
METRIC RANK
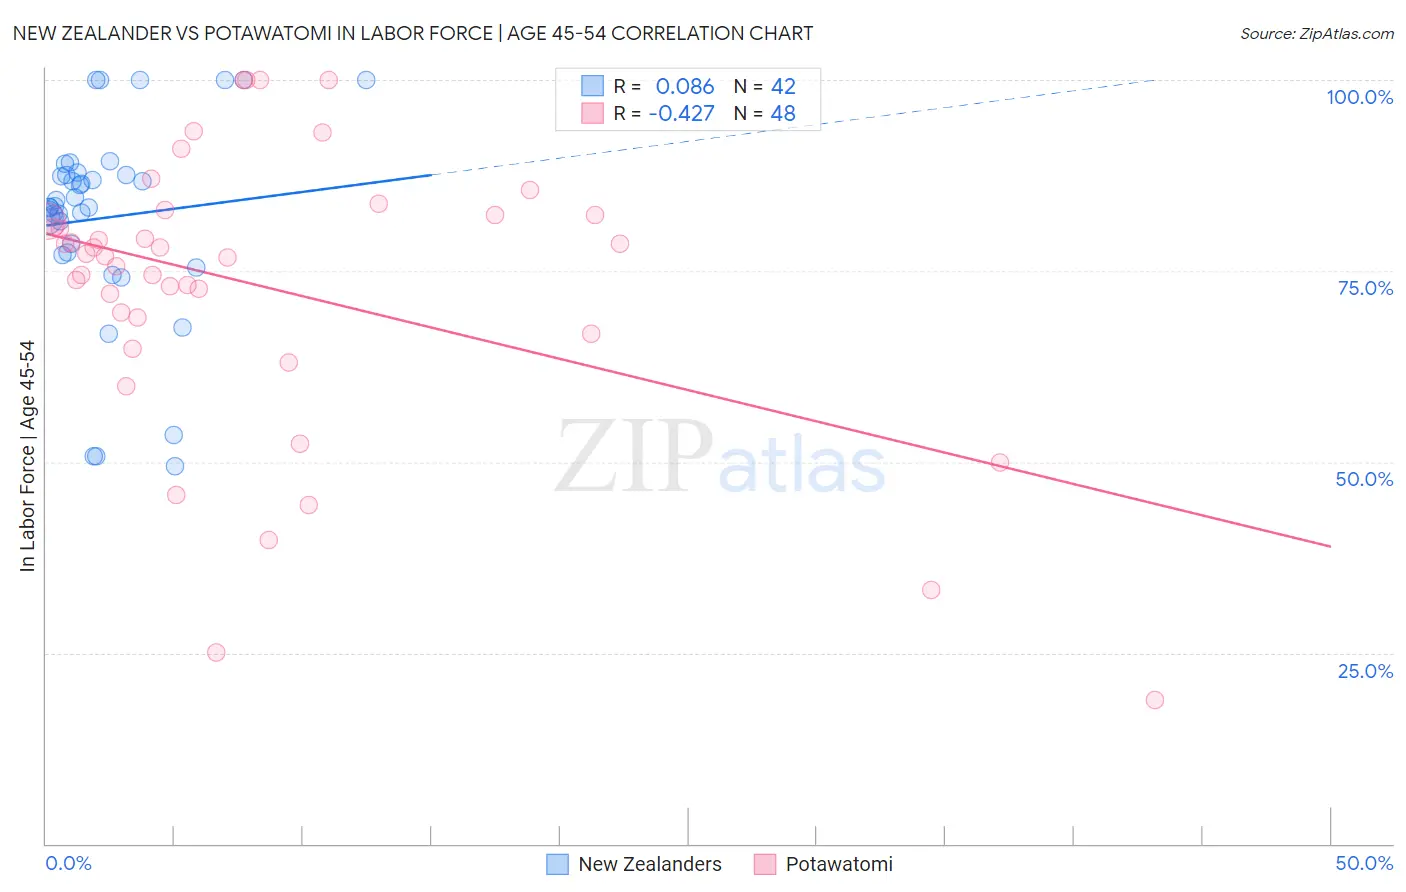
New Zealander vs Potawatomi In Labor Force | Age 45-54 Correlation Chart
The statistical analysis conducted on geographies consisting of 106,893,941 people shows a slight positive correlation between the proportion of New Zealanders and labor force participation rate among population between the ages 45 and 54 in the United States with a correlation coefficient (R) of 0.086 and weighted average of 82.6%. Similarly, the statistical analysis conducted on geographies consisting of 117,759,317 people shows a moderate negative correlation between the proportion of Potawatomi and labor force participation rate among population between the ages 45 and 54 in the United States with a correlation coefficient (R) of -0.427 and weighted average of 80.0%, a difference of 3.4%.
In Labor Force | Age 45-54 Correlation Summary
| Measurement | New Zealander | Potawatomi |
| Minimum | 49.5% | 18.8% |
| Maximum | 100.0% | 100.0% |
| Range | 50.5% | 81.2% |
| Mean | 82.0% | 72.9% |
| Median | 83.4% | 77.1% |
| Interquartile 25% (IQ1) | 77.4% | 67.9% |
| Interquartile 75% (IQ3) | 87.5% | 82.4% |
| Interquartile Range (IQR) | 10.1% | 14.5% |
| Standard Deviation (Sample) | 12.9% | 18.5% |
| Standard Deviation (Population) | 12.7% | 18.3% |
Similar Demographics by In Labor Force | Age 45-54
Demographics Similar to New Zealanders by In Labor Force | Age 45-54
In terms of in labor force | age 45-54, the demographic groups most similar to New Zealanders are European (82.6%, a difference of 0.0%), Immigrants from England (82.6%, a difference of 0.0%), Immigrants from Hungary (82.7%, a difference of 0.040%), Irish (82.6%, a difference of 0.040%), and Hungarian (82.7%, a difference of 0.050%).
| Demographics | Rating | Rank | In Labor Force | Age 45-54 |
| Northern Europeans | 46.9 /100 | #176 | Average 82.7% |
| Immigrants | Nicaragua | 44.6 /100 | #177 | Average 82.7% |
| Nigerians | 40.5 /100 | #178 | Average 82.7% |
| Immigrants | Switzerland | 39.4 /100 | #179 | Fair 82.7% |
| Hungarians | 38.0 /100 | #180 | Fair 82.7% |
| Israelis | 37.7 /100 | #181 | Fair 82.7% |
| Immigrants | Hungary | 37.1 /100 | #182 | Fair 82.7% |
| New Zealanders | 32.7 /100 | #183 | Fair 82.6% |
| Europeans | 32.6 /100 | #184 | Fair 82.6% |
| Immigrants | England | 32.2 /100 | #185 | Fair 82.6% |
| Irish | 29.2 /100 | #186 | Fair 82.6% |
| Immigrants | Costa Rica | 28.3 /100 | #187 | Fair 82.6% |
| South Africans | 28.0 /100 | #188 | Fair 82.6% |
| Syrians | 26.0 /100 | #189 | Fair 82.6% |
| British | 25.7 /100 | #190 | Fair 82.6% |
Demographics Similar to Potawatomi by In Labor Force | Age 45-54
In terms of in labor force | age 45-54, the demographic groups most similar to Potawatomi are Central American Indian (80.0%, a difference of 0.030%), Blackfeet (80.0%, a difference of 0.070%), Inupiat (79.9%, a difference of 0.090%), Spanish American (80.1%, a difference of 0.14%), and Immigrants from Dominican Republic (80.1%, a difference of 0.18%).
| Demographics | Rating | Rank | In Labor Force | Age 45-54 |
| Immigrants | Central America | 0.0 /100 | #302 | Tragic 80.2% |
| Immigrants | Azores | 0.0 /100 | #303 | Tragic 80.1% |
| Hispanics or Latinos | 0.0 /100 | #304 | Tragic 80.1% |
| Immigrants | Dominican Republic | 0.0 /100 | #305 | Tragic 80.1% |
| Spanish Americans | 0.0 /100 | #306 | Tragic 80.1% |
| Blackfeet | 0.0 /100 | #307 | Tragic 80.0% |
| Central American Indians | 0.0 /100 | #308 | Tragic 80.0% |
| Potawatomi | 0.0 /100 | #309 | Tragic 80.0% |
| Inupiat | 0.0 /100 | #310 | Tragic 79.9% |
| Mexicans | 0.0 /100 | #311 | Tragic 79.8% |
| Immigrants | Mexico | 0.0 /100 | #312 | Tragic 79.7% |
| Colville | 0.0 /100 | #313 | Tragic 79.5% |
| Ottawa | 0.0 /100 | #314 | Tragic 79.5% |
| Blacks/African Americans | 0.0 /100 | #315 | Tragic 79.3% |
| Shoshone | 0.0 /100 | #316 | Tragic 79.3% |