Immigrants from the Azores vs Seminole In Labor Force | Age 45-54
COMPARE
Immigrants from the Azores
Seminole
In Labor Force | Age 45-54
In Labor Force | Age 45-54 Comparison
Immigrants from the Azores
Seminole
80.1%
IN LABOR FORCE | AGE 45-54
0.0/ 100
METRIC RATING
303rd/ 347
METRIC RANK
78.1%
IN LABOR FORCE | AGE 45-54
0.0/ 100
METRIC RATING
326th/ 347
METRIC RANK
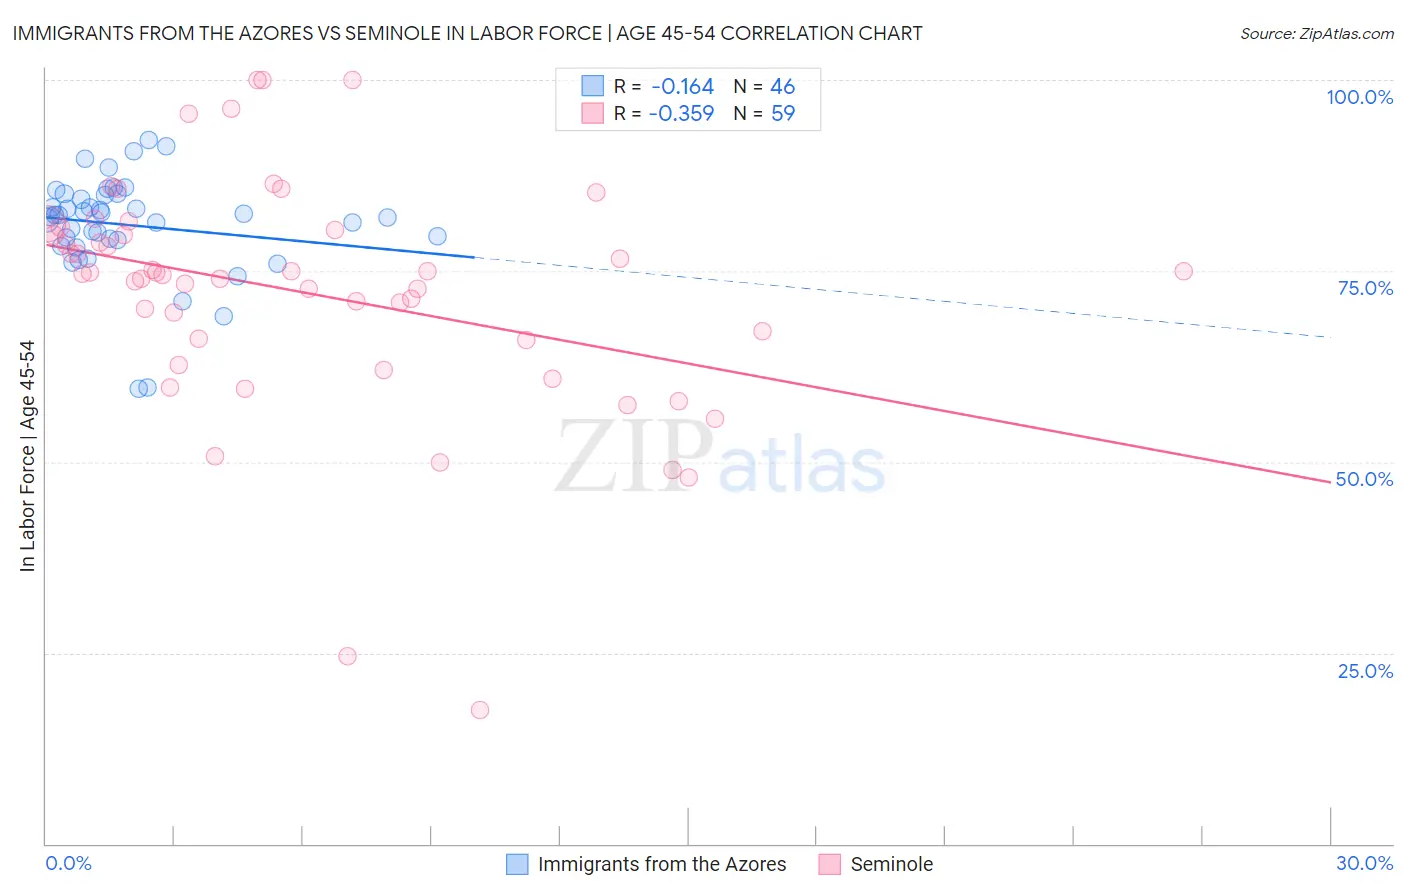
Immigrants from the Azores vs Seminole In Labor Force | Age 45-54 Correlation Chart
The statistical analysis conducted on geographies consisting of 46,256,380 people shows a poor negative correlation between the proportion of Immigrants from the Azores and labor force participation rate among population between the ages 45 and 54 in the United States with a correlation coefficient (R) of -0.164 and weighted average of 80.1%. Similarly, the statistical analysis conducted on geographies consisting of 118,297,106 people shows a mild negative correlation between the proportion of Seminole and labor force participation rate among population between the ages 45 and 54 in the United States with a correlation coefficient (R) of -0.359 and weighted average of 78.1%, a difference of 2.5%.
In Labor Force | Age 45-54 Correlation Summary
| Measurement | Immigrants from the Azores | Seminole |
| Minimum | 59.5% | 17.5% |
| Maximum | 92.2% | 100.0% |
| Range | 32.7% | 82.5% |
| Mean | 81.0% | 72.2% |
| Median | 82.2% | 74.7% |
| Interquartile 25% (IQ1) | 79.1% | 65.9% |
| Interquartile 75% (IQ3) | 85.0% | 80.4% |
| Interquartile Range (IQR) | 5.9% | 14.5% |
| Standard Deviation (Sample) | 6.6% | 15.5% |
| Standard Deviation (Population) | 6.5% | 15.4% |
Similar Demographics by In Labor Force | Age 45-54
Demographics Similar to Immigrants from the Azores by In Labor Force | Age 45-54
In terms of in labor force | age 45-54, the demographic groups most similar to Immigrants from the Azores are Hispanic or Latino (80.1%, a difference of 0.020%), Immigrants from Dominican Republic (80.1%, a difference of 0.030%), Immigrants from Central America (80.2%, a difference of 0.070%), Spanish American (80.1%, a difference of 0.070%), and Spanish American Indian (80.2%, a difference of 0.14%).
| Demographics | Rating | Rank | In Labor Force | Age 45-54 |
| Africans | 0.0 /100 | #296 | Tragic 80.5% |
| Americans | 0.0 /100 | #297 | Tragic 80.4% |
| Marshallese | 0.0 /100 | #298 | Tragic 80.3% |
| Dominicans | 0.0 /100 | #299 | Tragic 80.3% |
| Fijians | 0.0 /100 | #300 | Tragic 80.2% |
| Spanish American Indians | 0.0 /100 | #301 | Tragic 80.2% |
| Immigrants | Central America | 0.0 /100 | #302 | Tragic 80.2% |
| Immigrants | Azores | 0.0 /100 | #303 | Tragic 80.1% |
| Hispanics or Latinos | 0.0 /100 | #304 | Tragic 80.1% |
| Immigrants | Dominican Republic | 0.0 /100 | #305 | Tragic 80.1% |
| Spanish Americans | 0.0 /100 | #306 | Tragic 80.1% |
| Blackfeet | 0.0 /100 | #307 | Tragic 80.0% |
| Central American Indians | 0.0 /100 | #308 | Tragic 80.0% |
| Potawatomi | 0.0 /100 | #309 | Tragic 80.0% |
| Inupiat | 0.0 /100 | #310 | Tragic 79.9% |
Demographics Similar to Seminole by In Labor Force | Age 45-54
In terms of in labor force | age 45-54, the demographic groups most similar to Seminole are Cajun (78.1%, a difference of 0.0%), Choctaw (78.2%, a difference of 0.050%), Dutch West Indian (78.2%, a difference of 0.14%), Kiowa (78.3%, a difference of 0.16%), and Sioux (78.0%, a difference of 0.23%).
| Demographics | Rating | Rank | In Labor Force | Age 45-54 |
| Cherokee | 0.0 /100 | #319 | Tragic 79.0% |
| Yaqui | 0.0 /100 | #320 | Tragic 78.9% |
| Yup'ik | 0.0 /100 | #321 | Tragic 78.6% |
| Crow | 0.0 /100 | #322 | Tragic 78.3% |
| Kiowa | 0.0 /100 | #323 | Tragic 78.3% |
| Dutch West Indians | 0.0 /100 | #324 | Tragic 78.2% |
| Choctaw | 0.0 /100 | #325 | Tragic 78.2% |
| Seminole | 0.0 /100 | #326 | Tragic 78.1% |
| Cajuns | 0.0 /100 | #327 | Tragic 78.1% |
| Sioux | 0.0 /100 | #328 | Tragic 78.0% |
| Creek | 0.0 /100 | #329 | Tragic 77.7% |
| Cheyenne | 0.0 /100 | #330 | Tragic 77.6% |
| Tsimshian | 0.0 /100 | #331 | Tragic 77.4% |
| Menominee | 0.0 /100 | #332 | Tragic 77.4% |
| Natives/Alaskans | 0.0 /100 | #333 | Tragic 77.1% |